On a metered product, the interface is the price list.
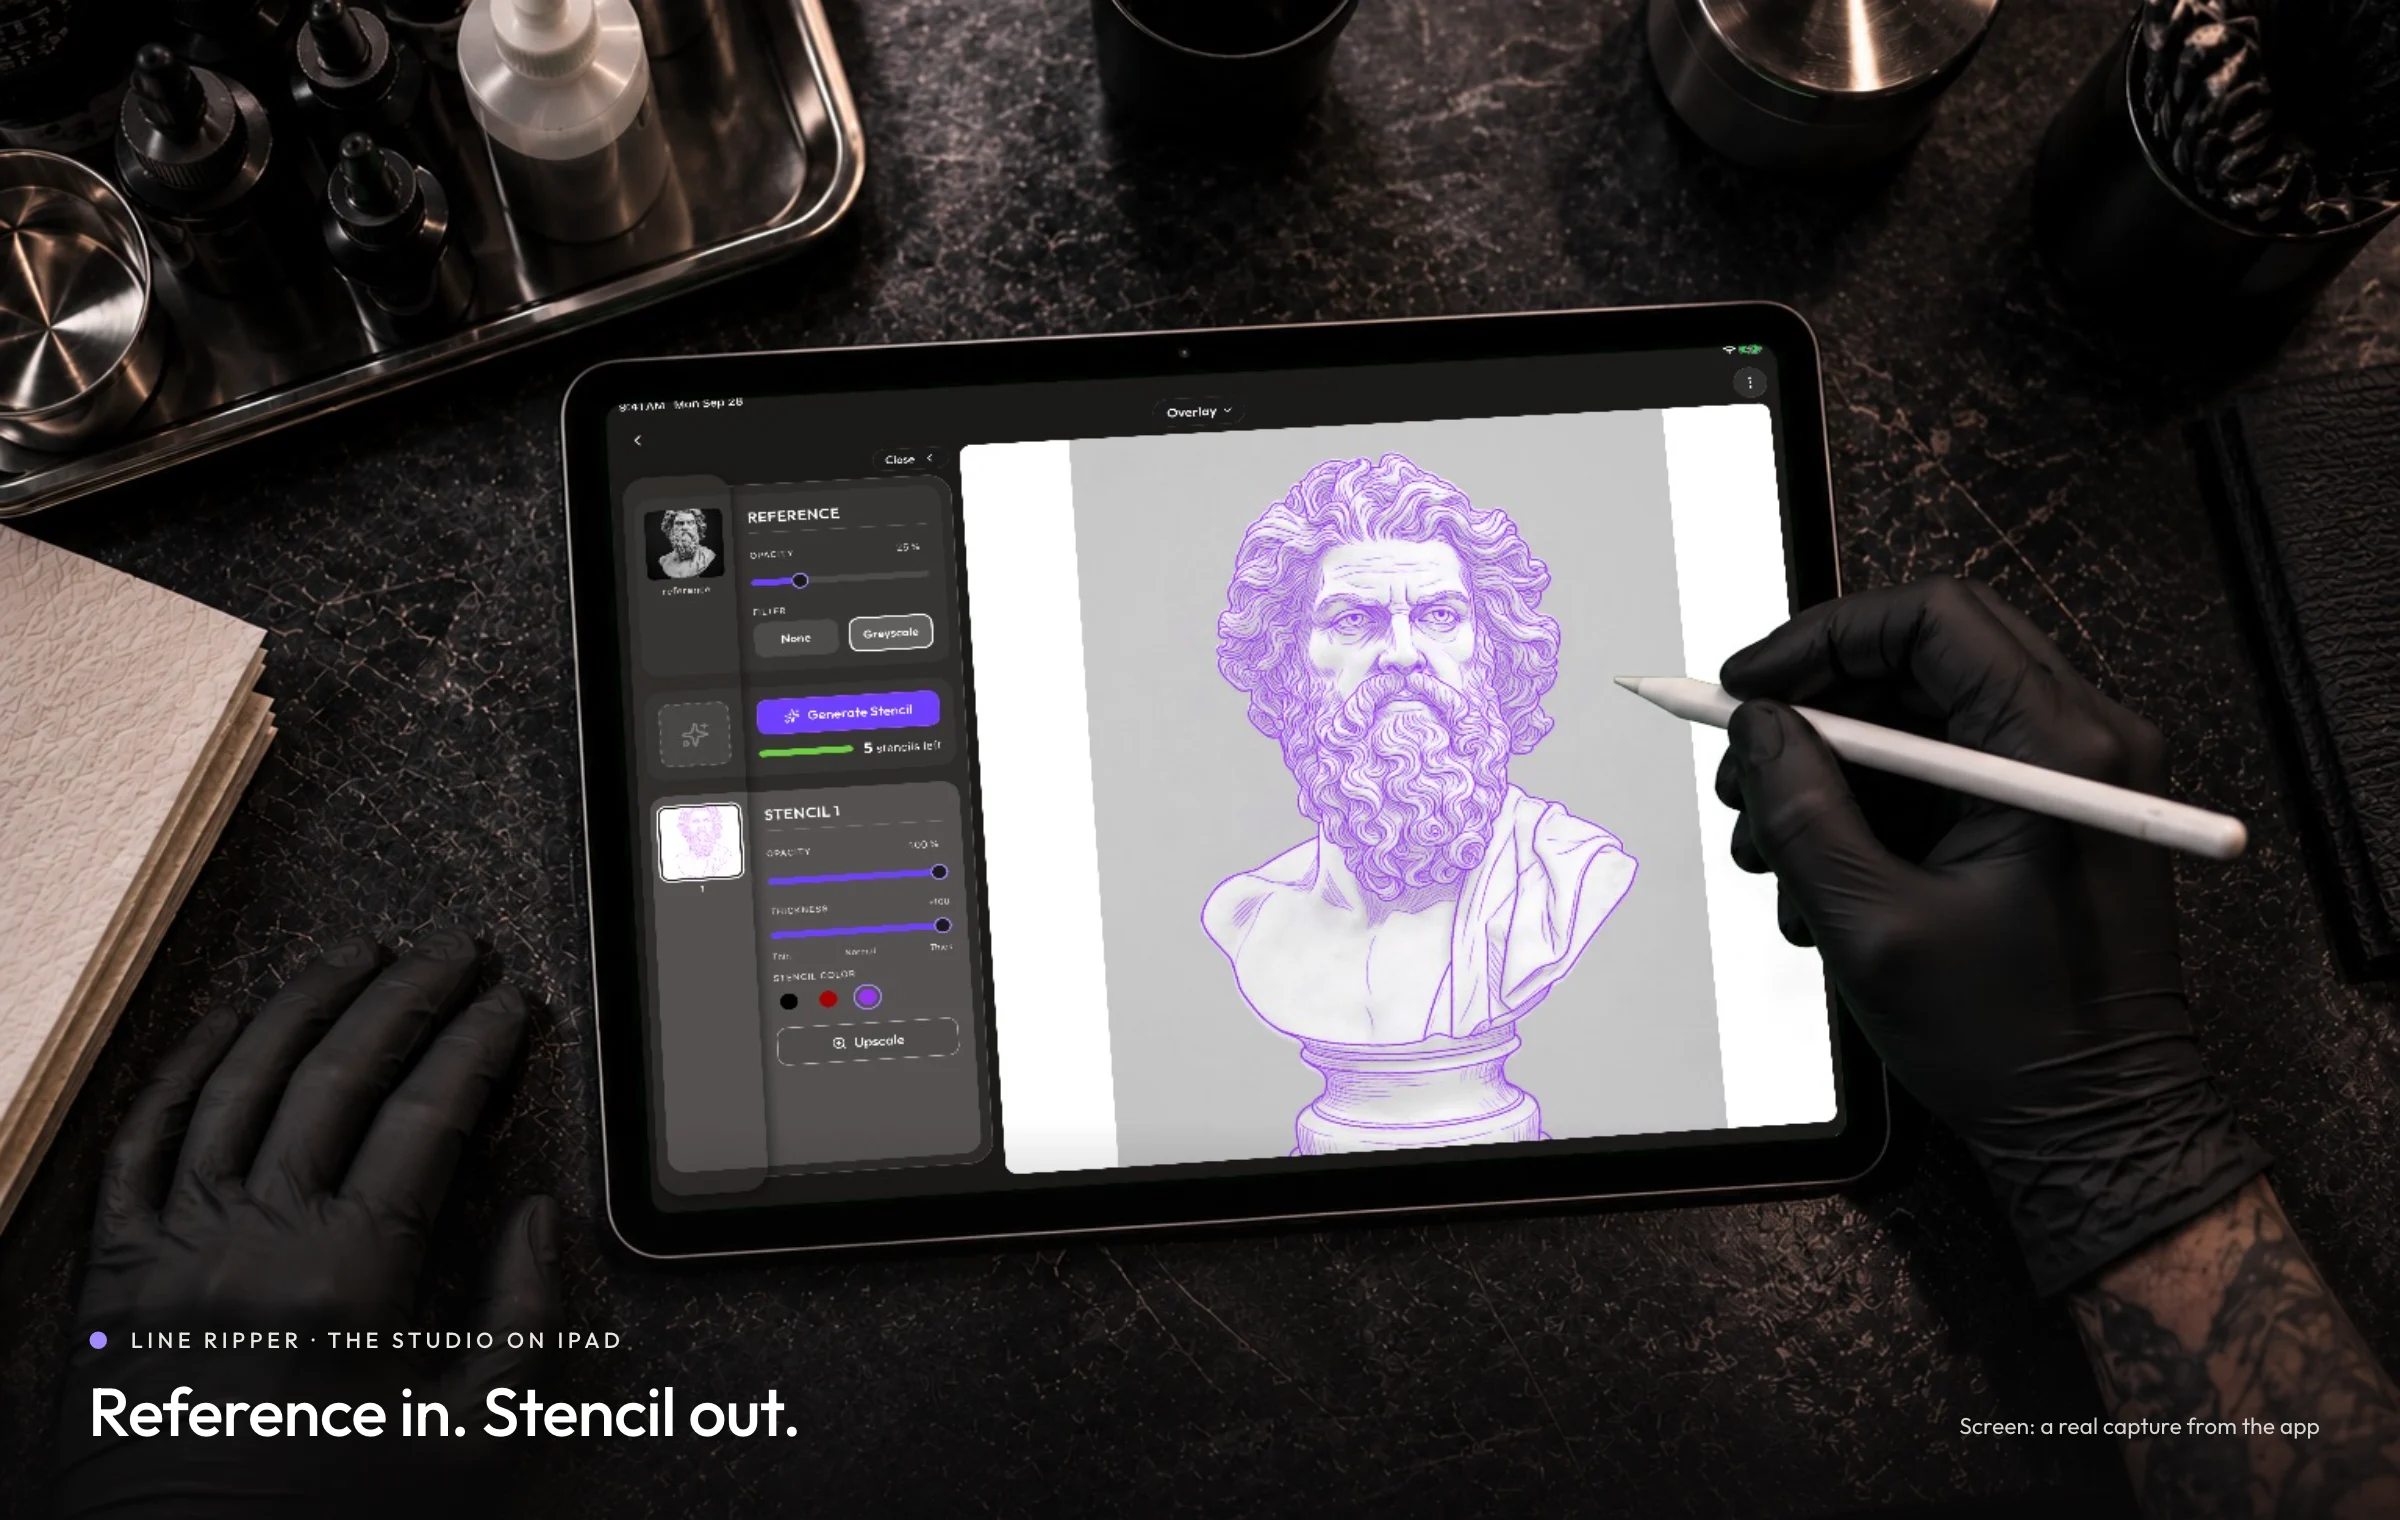
Line Ripper turns a reference image into a print-ready tattoo stencil. It sells a metered credit, so the interface is also the pricing surface. I designed the iPad and iPhone app around making that meter legible, which meant taking the app's headline action out of the toolbar.
I am the Founding Designer and Product Lead at Line Ripper. I designed the web app and the iPad and iPhone app, and built around 90 to 95% of the mobile front end myself, using Claude Code and Conductor.
The web app was the soft launch: an MVP, live since December 2025, which had earned about CA$45,000 as of September 2026. The iPad and iPhone app was the hard launch, on the App Store on 15 September 2026, too recently to have a result of its own. So the revenue is the business these decisions were made for, and not something they produced.
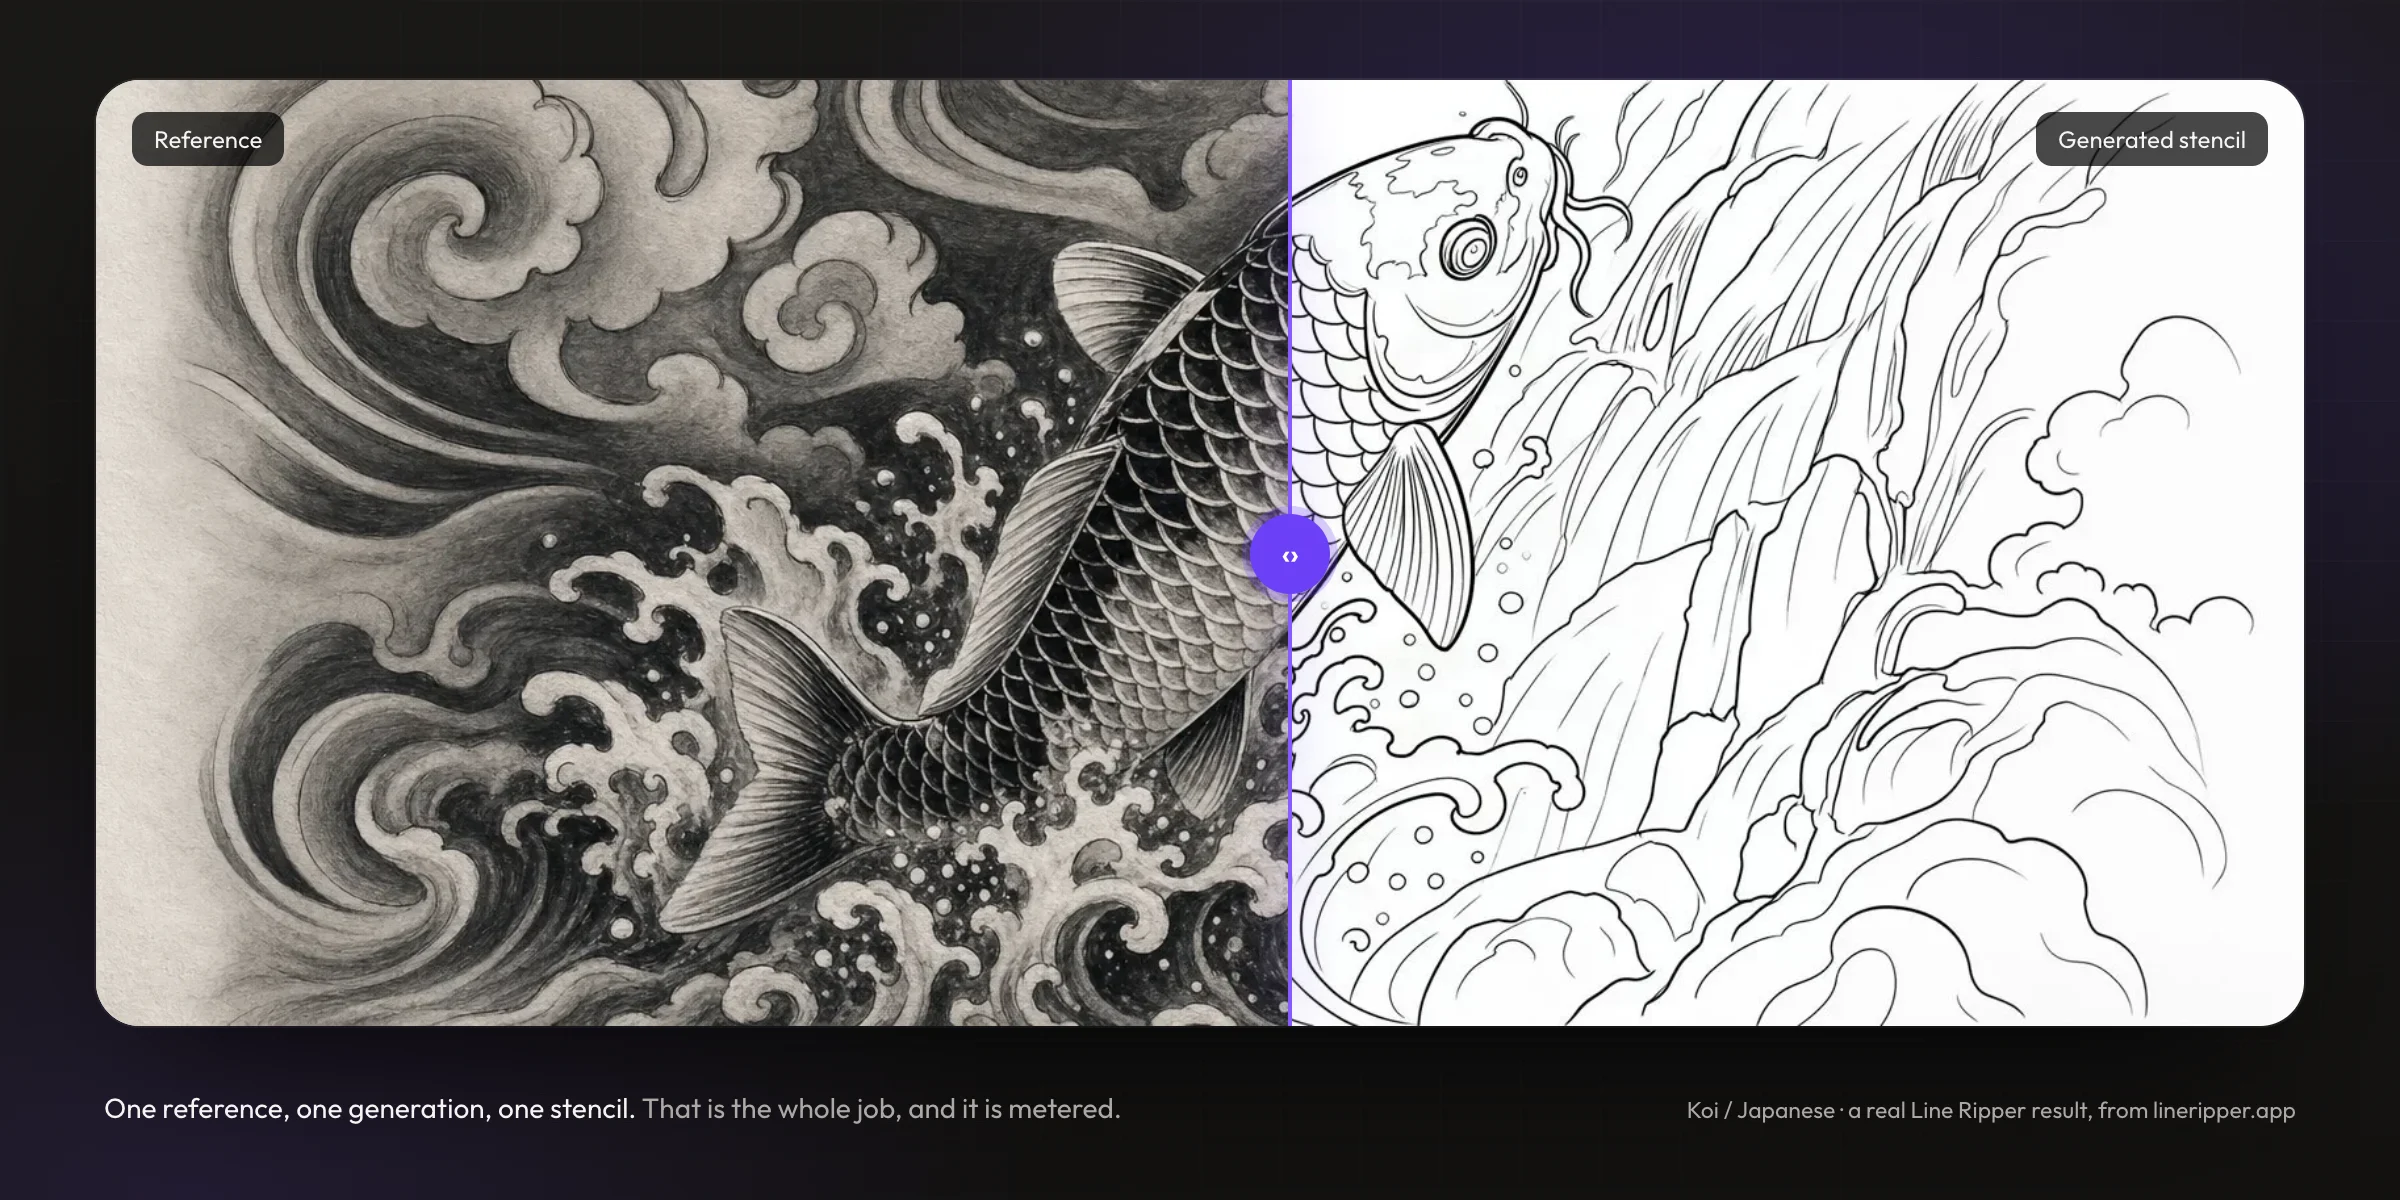
The web app proved the business, and showed where it is decided.
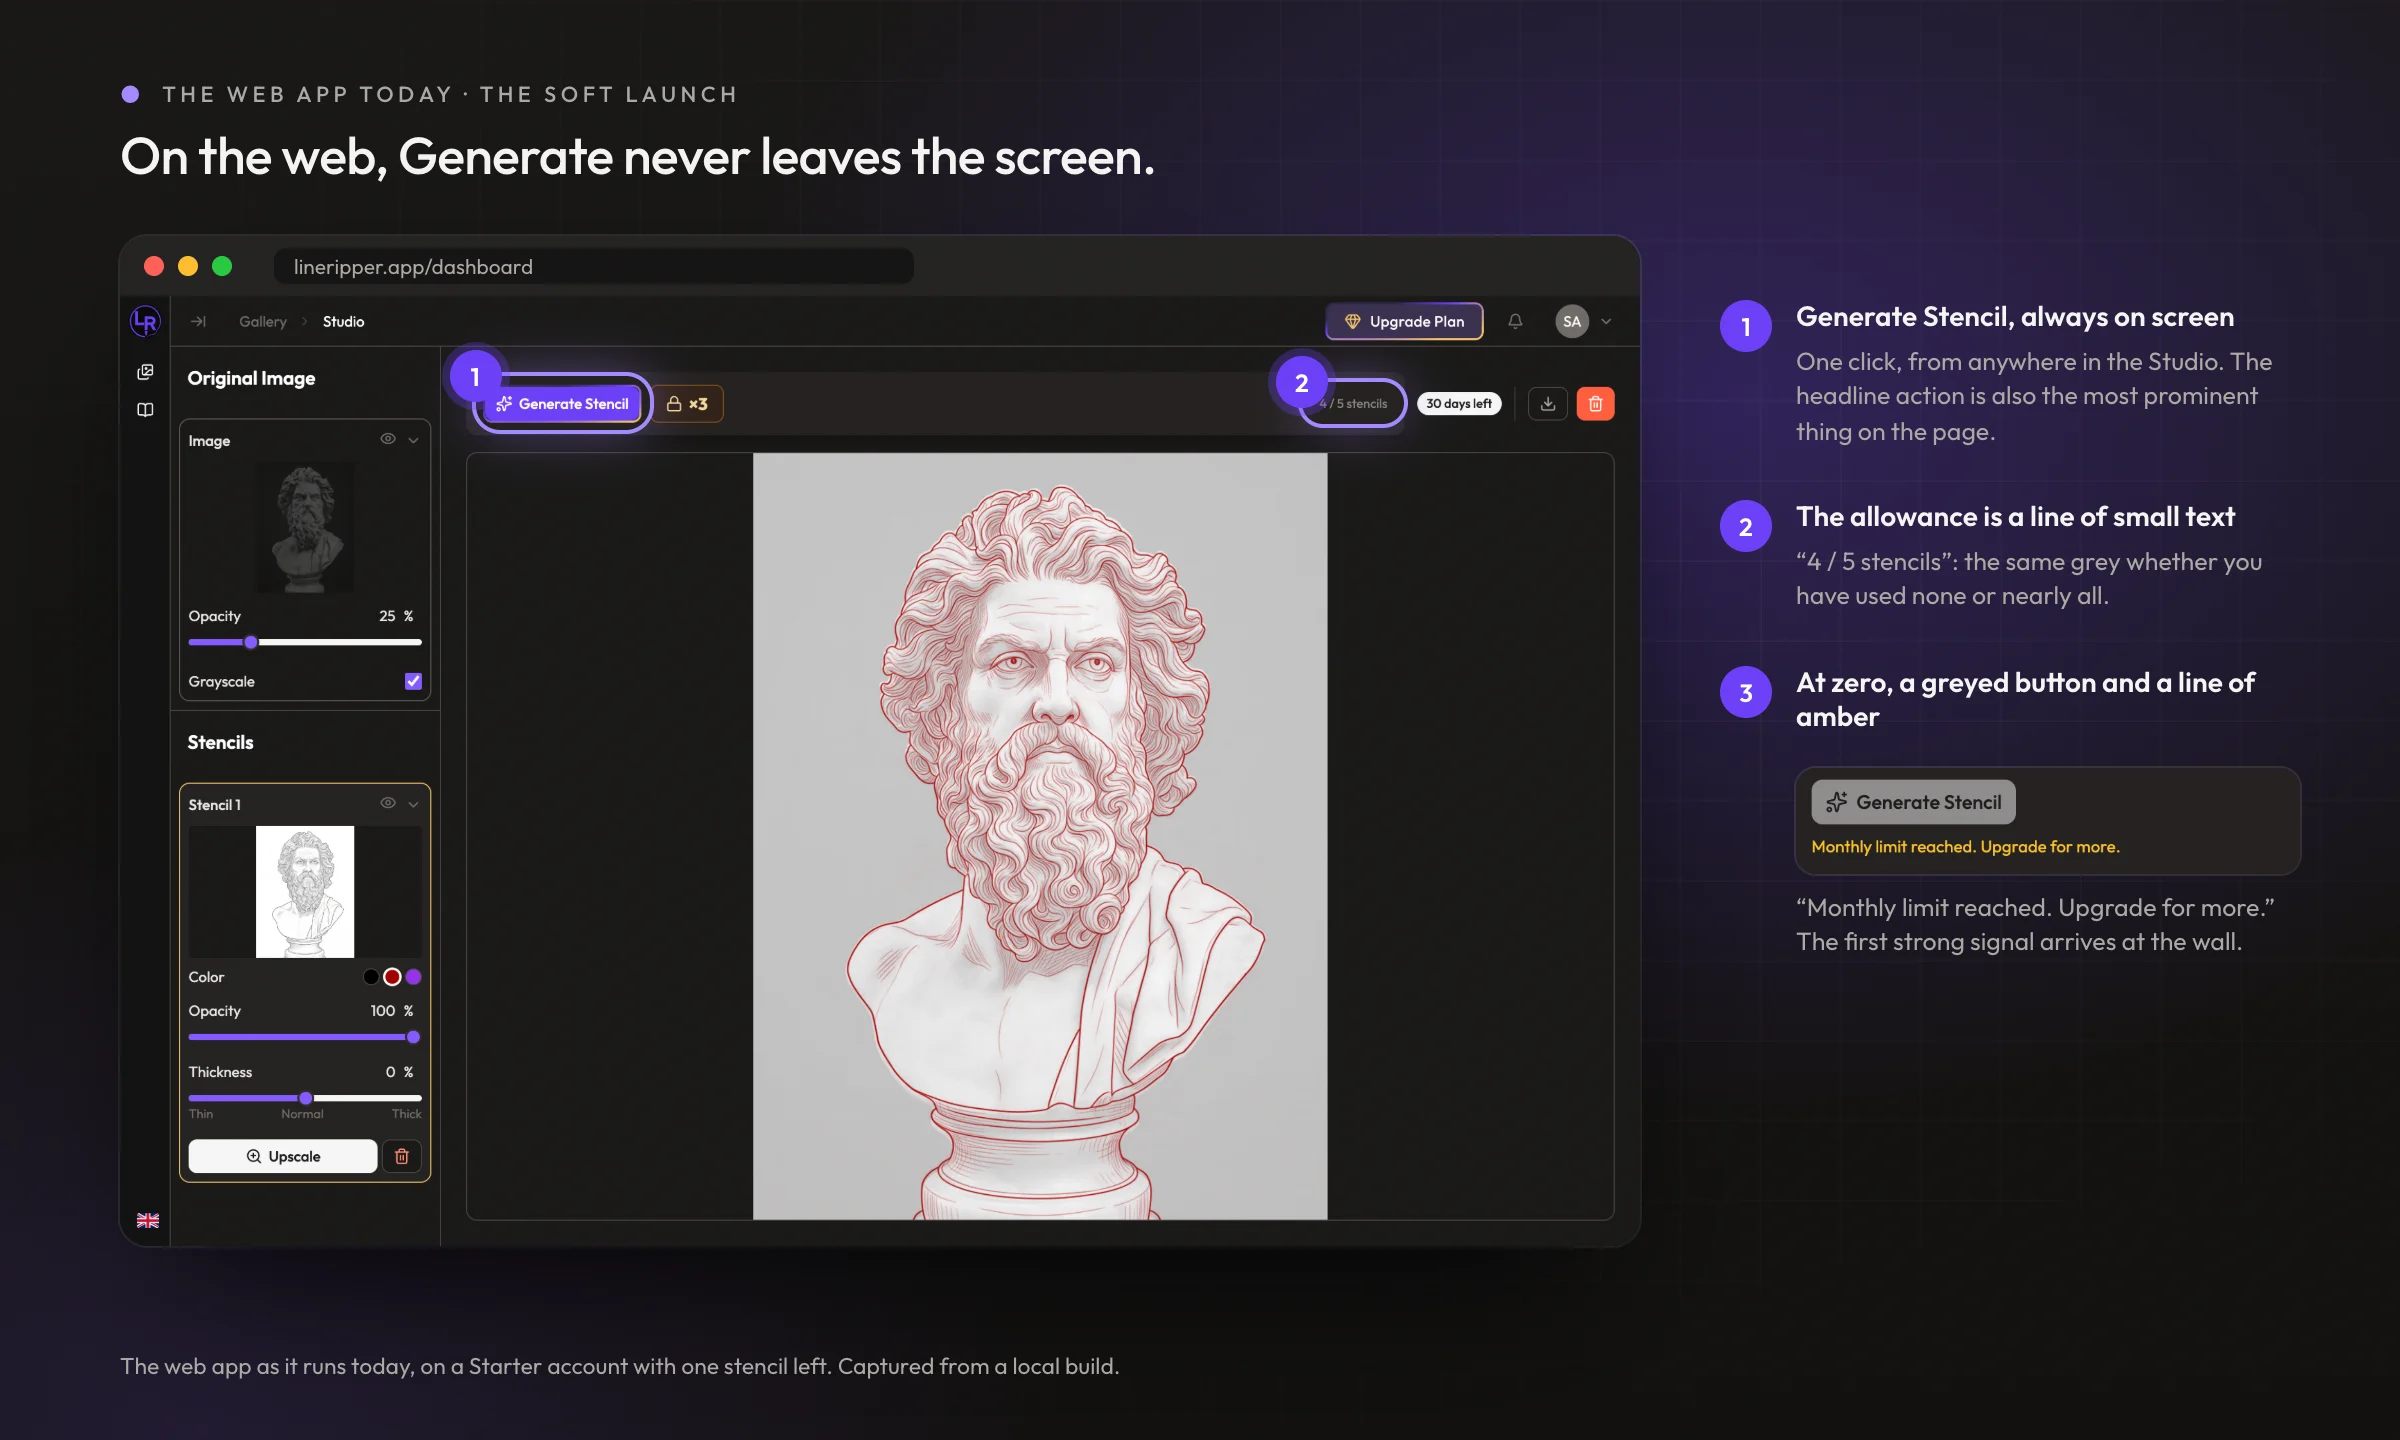
The web app came first, as the MVP. It is where the revenue was earned and where every number on this page comes from, so it is also the baseline the native app was designed against. On the web, generating is a permanent button in the toolbar, and the plan's limit is a line of small grey text until the moment it runs out.
A free plan gives five stencil generations. The business is what happens after the fifth. So the app had to make a limit that nobody can see feel present, without making the product feel stingy about the one thing it does.
A generation is spent at the moment it is made and is never returned. That single fact sets the terms for everything below. A misfired tap costs a customer real money, and on a free plan it costs them a fifth of everything they were given. So the interface cannot treat the main action as free, which is exactly what a permanent call to action does.
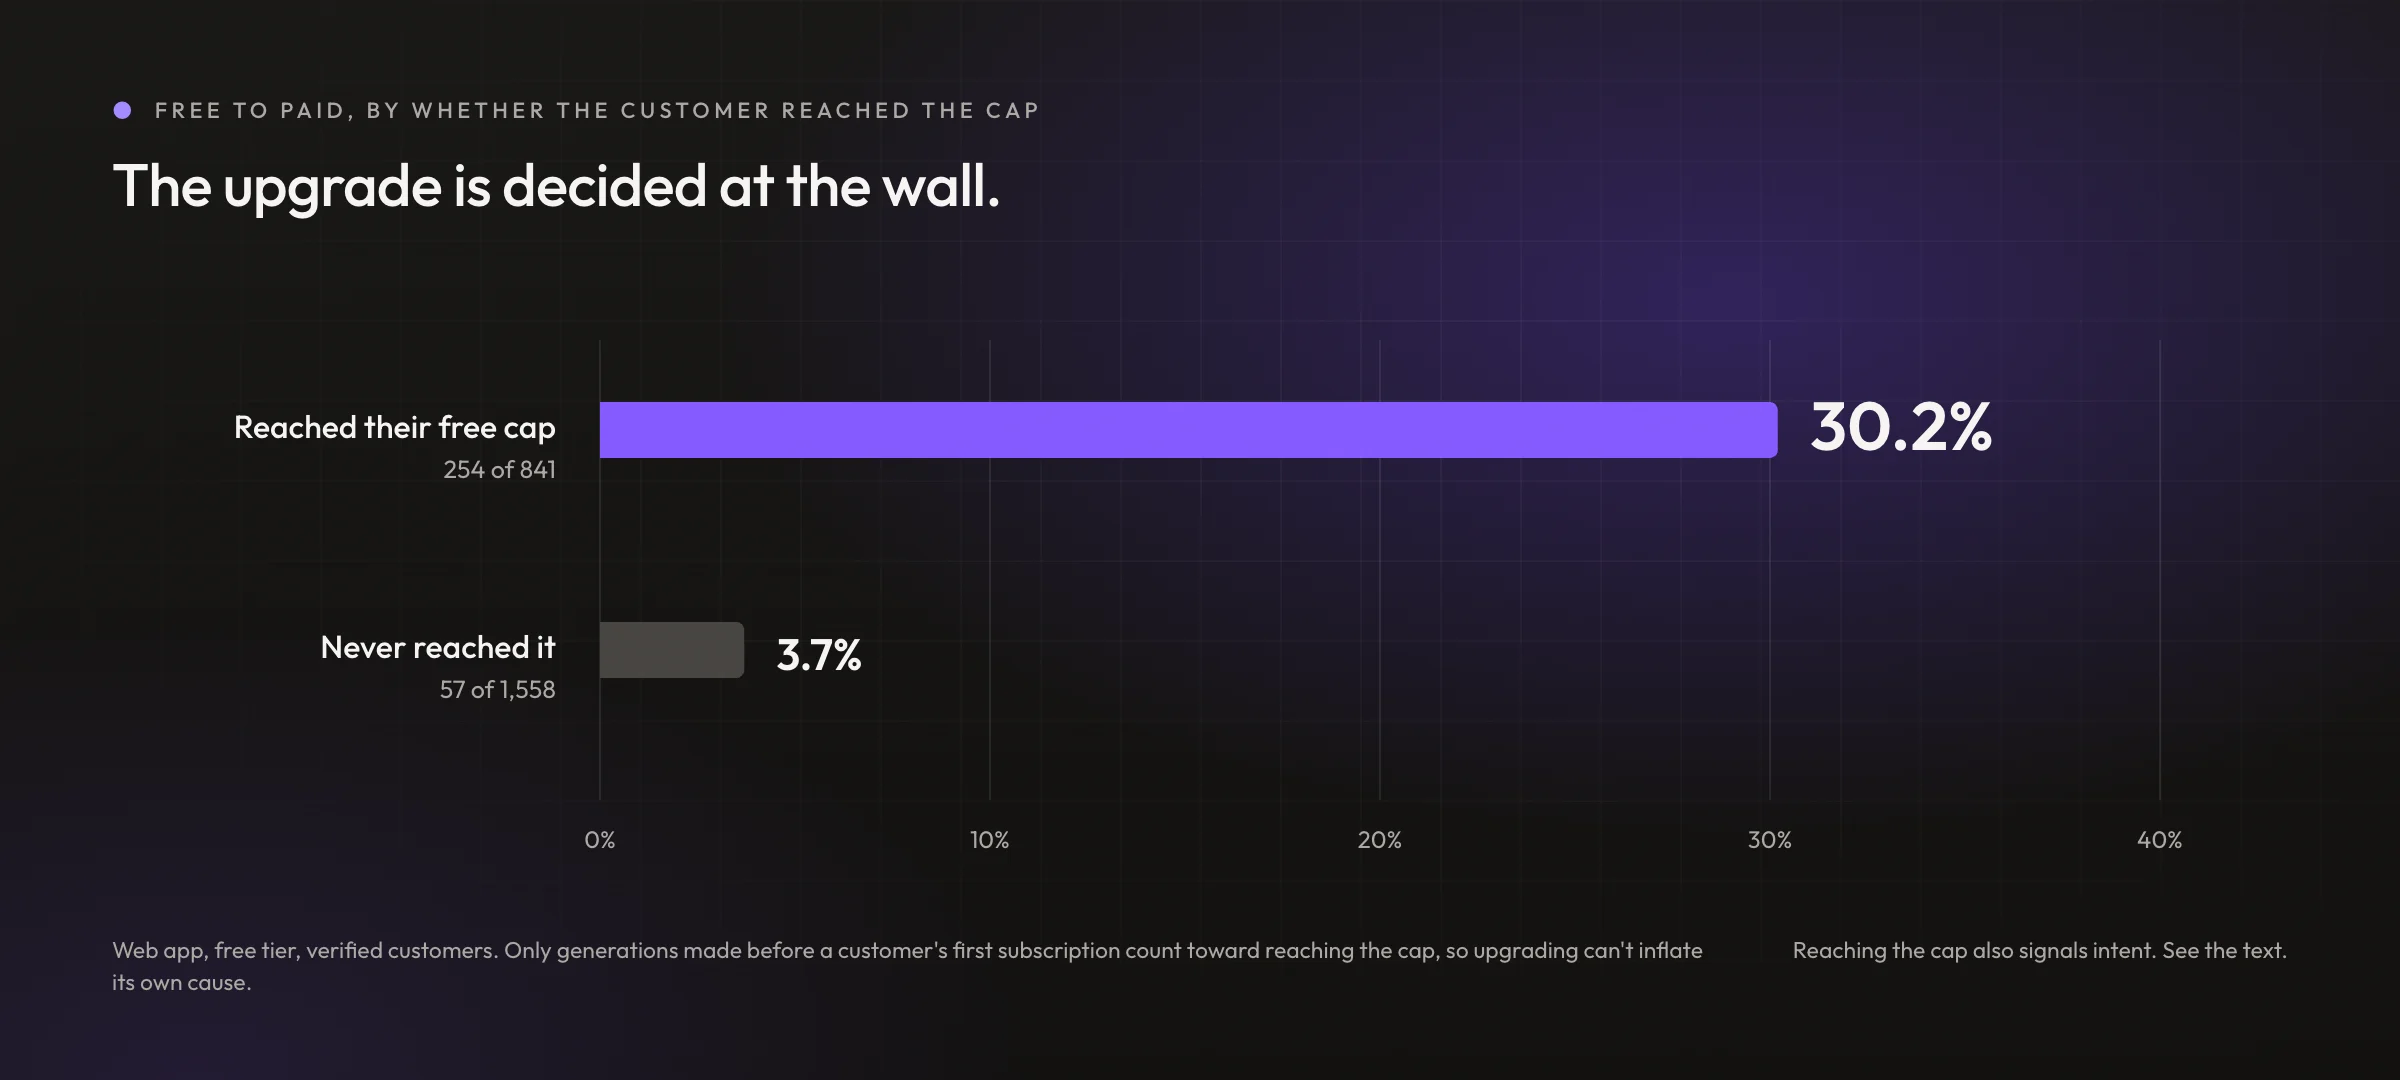
The data says where that moment is. Of the 841 free customers who reached their cap on the web app, 254 upgraded, which is 30.2%. Of the 1,558 who never reached it, 57 upgraded, which is 3.7%. Only generations made before someone's first subscription count toward reaching the cap, so upgrading cannot inflate its own cause.
The obvious objection is worth stating rather than waiting for. Reaching a cap is itself a measure of intent, so some of that gap is simply the difference between a customer who used the product and one who barely did. The 3.7% is largely people who never generated anything. What survives the objection is the narrower claim, and it is the one the design rests on: the upgrade decision is made at the wall. Close to a third of the customers who arrive there pay, which makes it the highest-intent moment in the product and the one worth designing most carefully.
And the limit keeps being felt. Between 25% and 37% of active free customers hit their cap in every billing cycle from the first to the eighth. It does not spike for new customers and then fade. The cycles with the highest rates are the third and fourth, which are the customers who stayed.
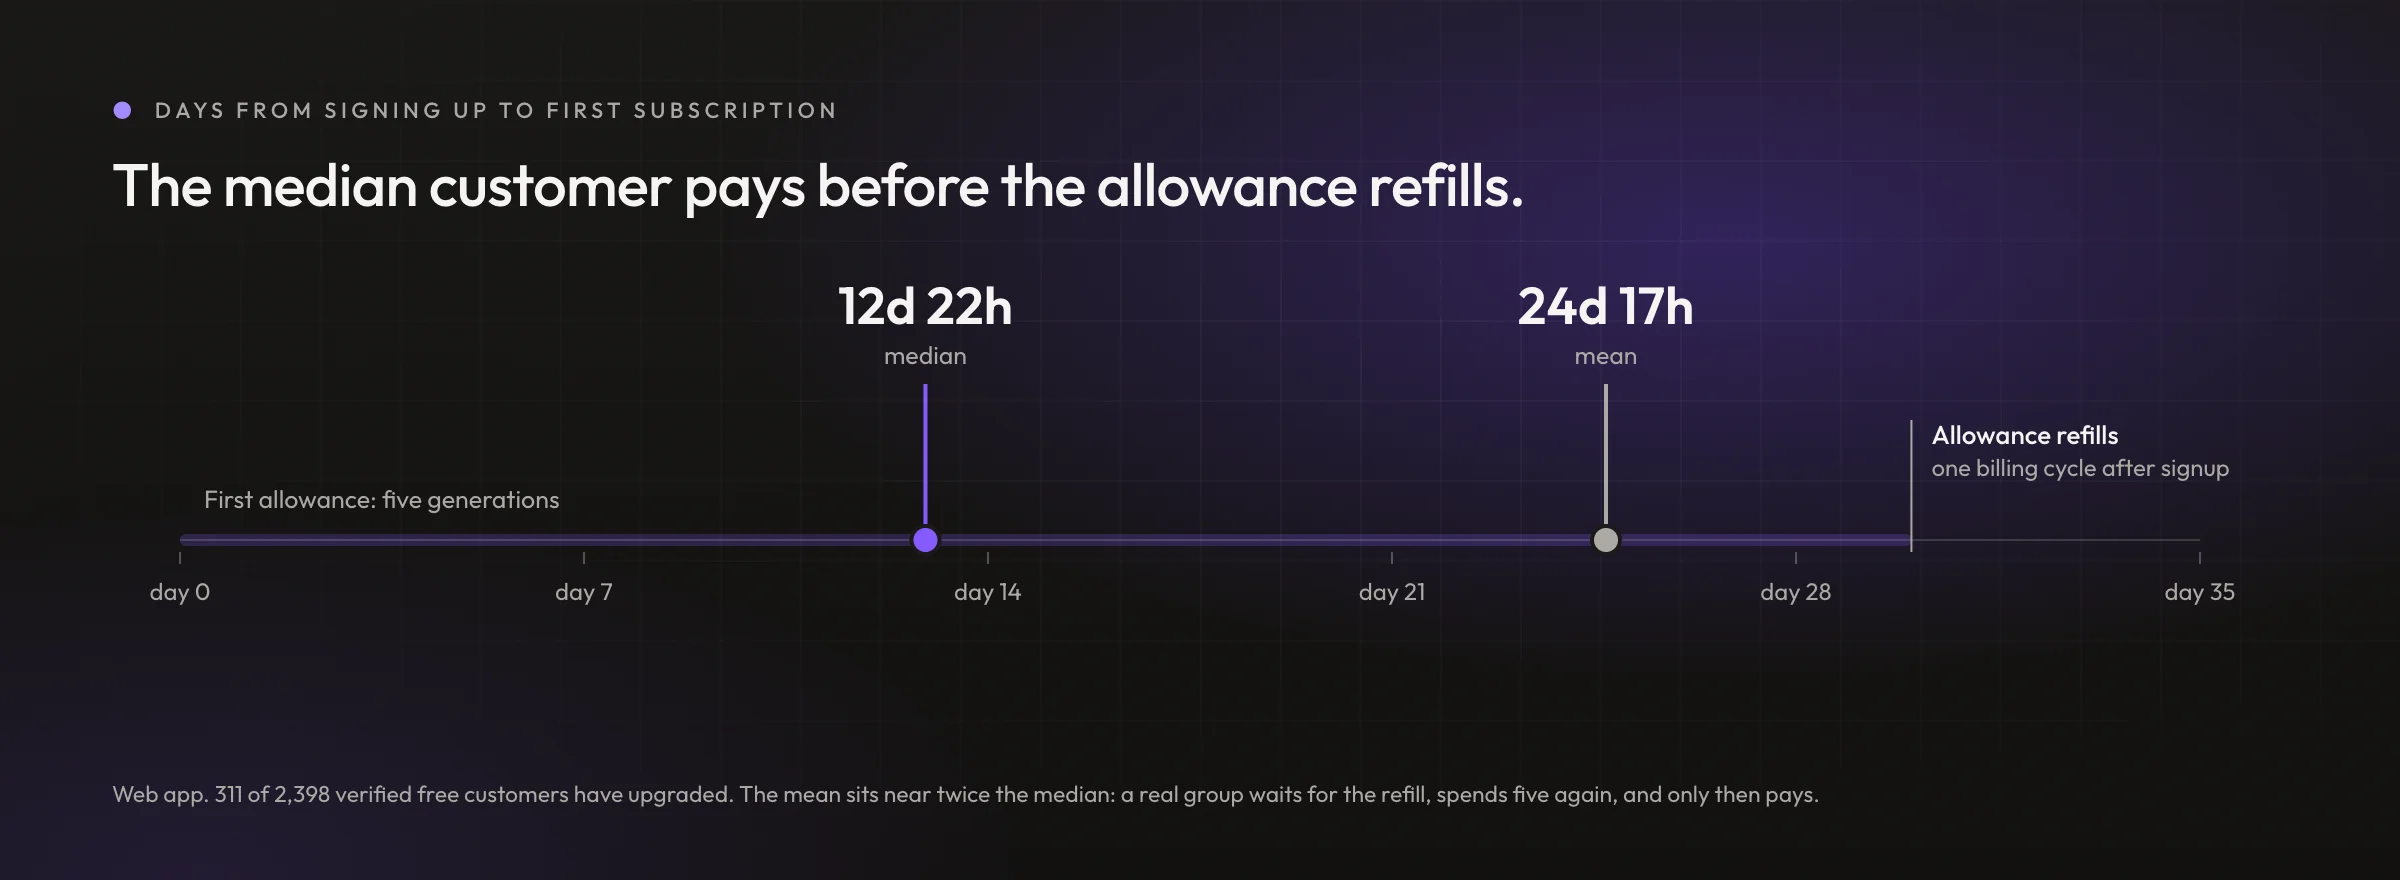
The timing agrees. 311 of 2,398 verified free customers have upgraded, close to 13%, and the median one took just under 13 days. A free plan resets on the anniversary of signing up, so the median customer who pays does it before their allowance has refilled even once. The decision is being made at the cap rather than at the reset.
Built for the iPad, where artists already trace stencils by hand.
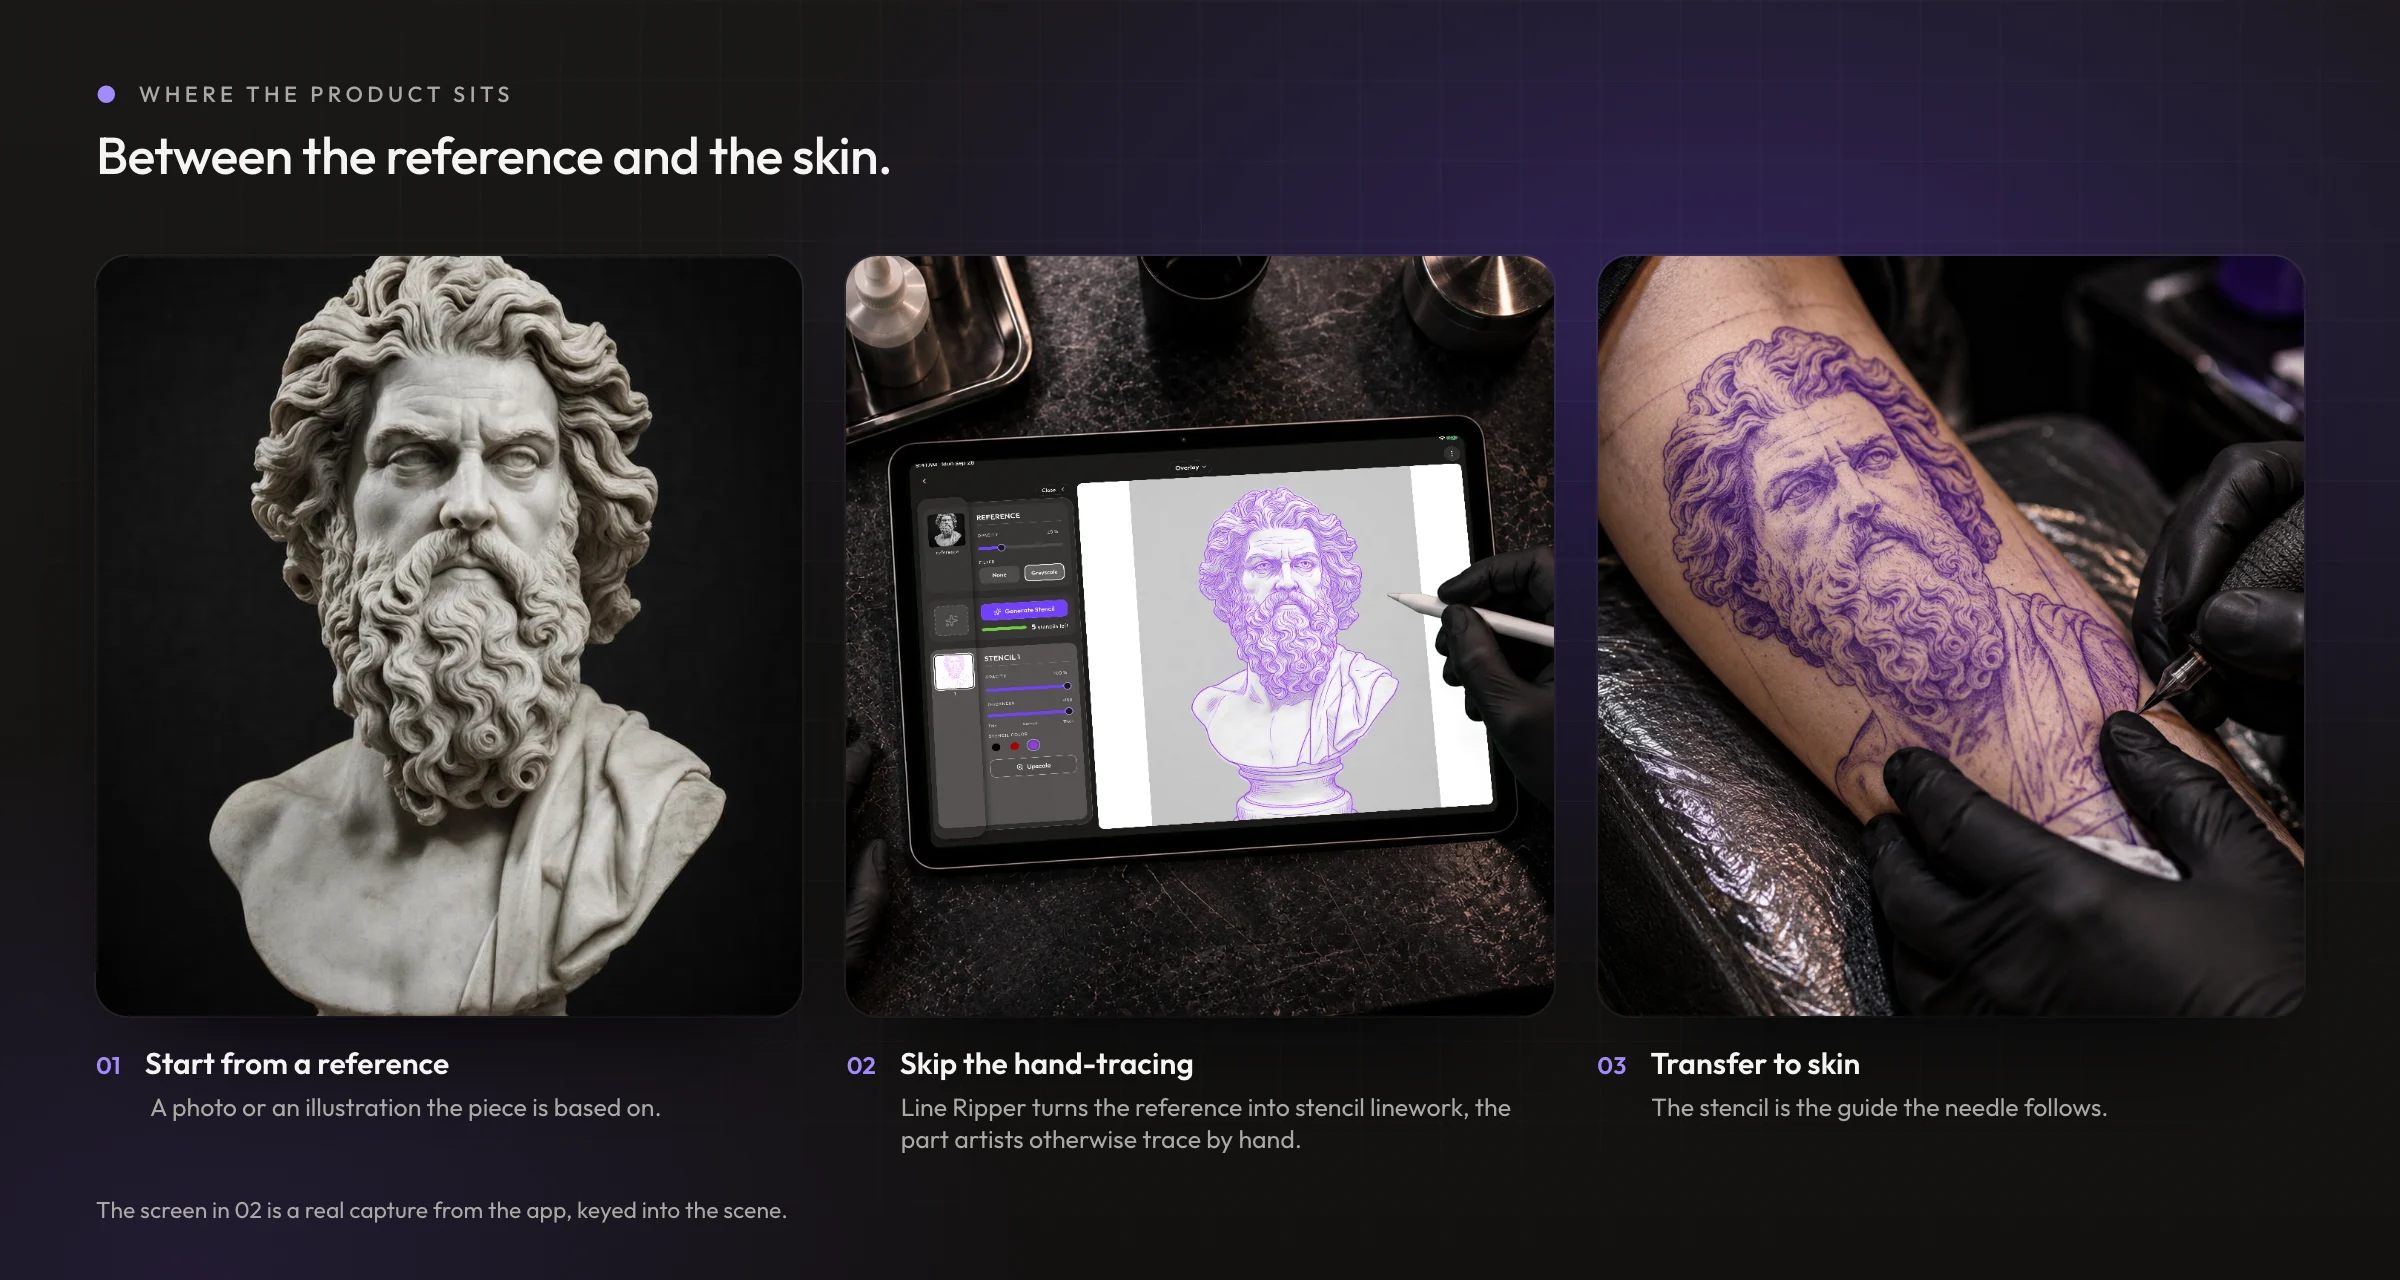
Before the web app launched I had four separate reasons to think our customers work on iPads, and the strongest of them is structural rather than observed. The industry standard for drawing a stencil by hand is Procreate, and Procreate runs on iOS and nowhere else. The incumbent workflow cannot happen on Android or on Windows, and nobody draws on a phone. Alongside that: a discovery interview with a tattoo artist who owns his own studio; video research into how artists actually make stencils, which was consistently shot on an iPad; and, a couple of months after the web soft launch, a walk around a tattoo convention where every tablet I saw was an iPad. That last one is an informal observation rather than a count, and it confirmed the bet rather than making it.
The web app's own device numbers cannot check any of this. We tell people at sign-in that the experience is best on a desktop, so the device split measures our own instruction as much as our customers' habits. The mobile app is the first surface that will answer it honestly.
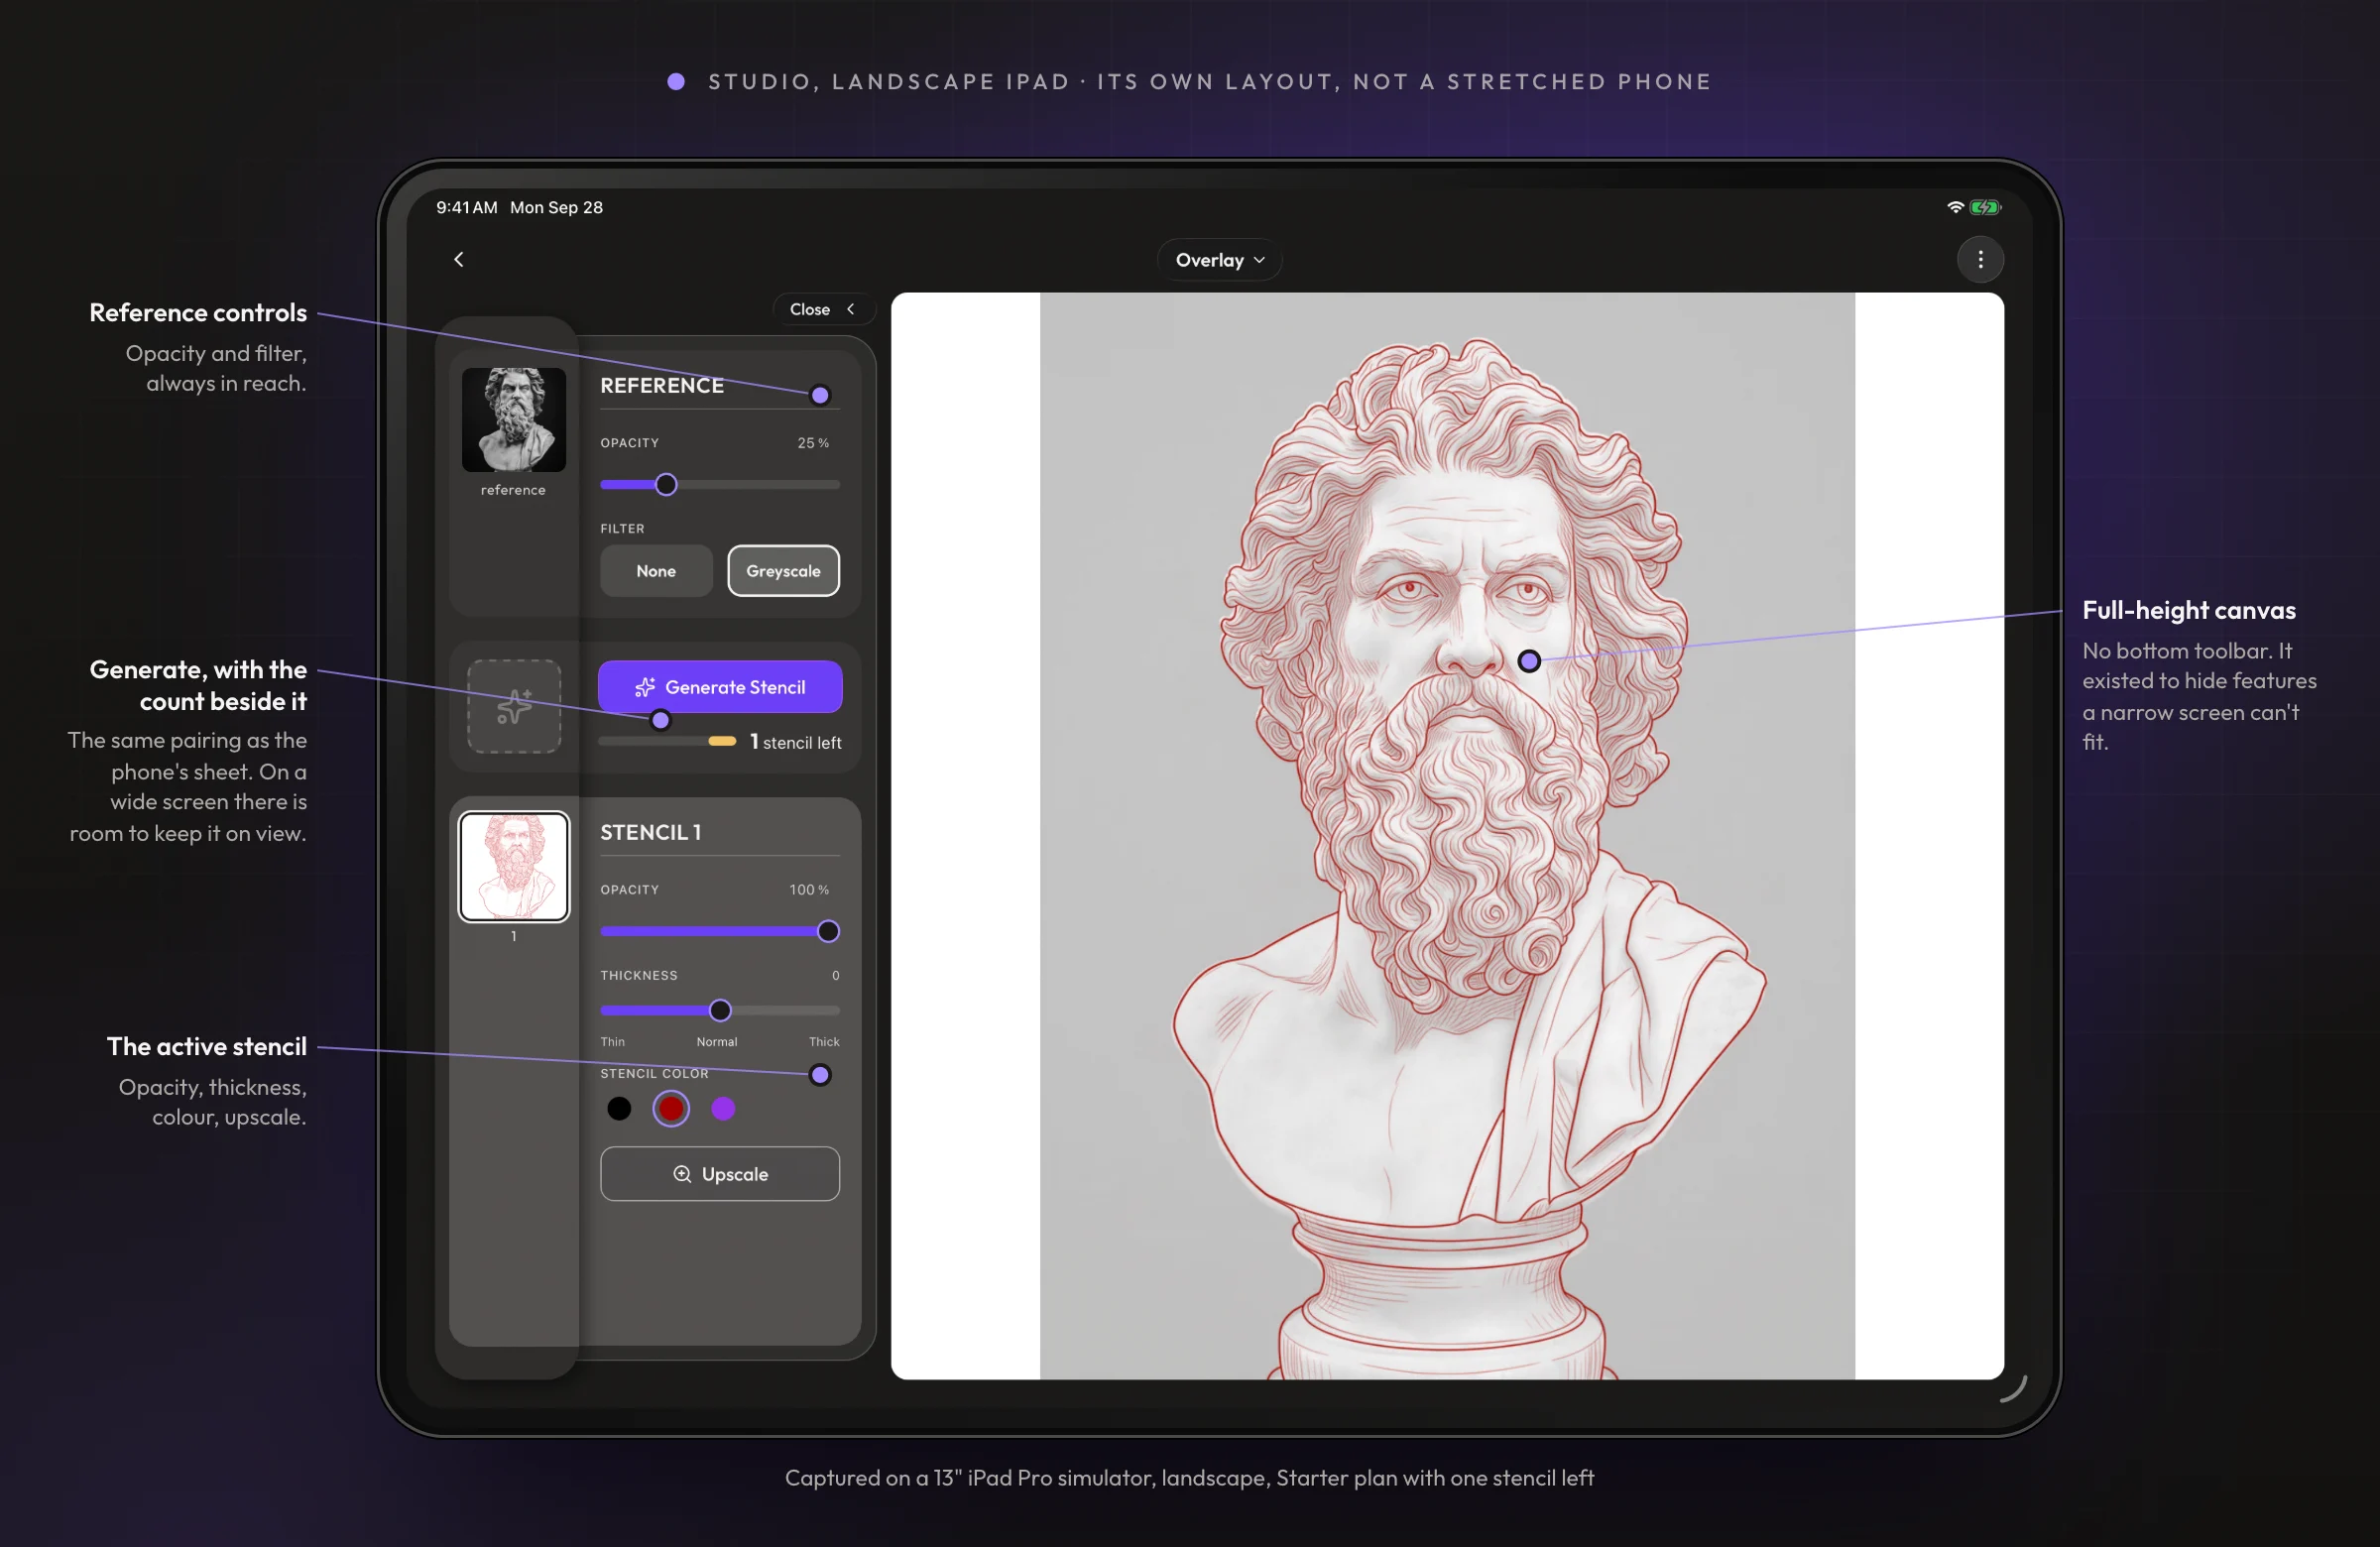
So the mobile build had to be right in landscape rather than right on a phone. The phone layout is built around a bottom toolbar whose job is to hide features, because a narrow screen has to. On a wide screen that logic inverts. I rebuilt the Studio for landscape as its own layout, with everything on view beside a full-height canvas, rather than adapting the toolbar.
Generate moves out of the toolbar.
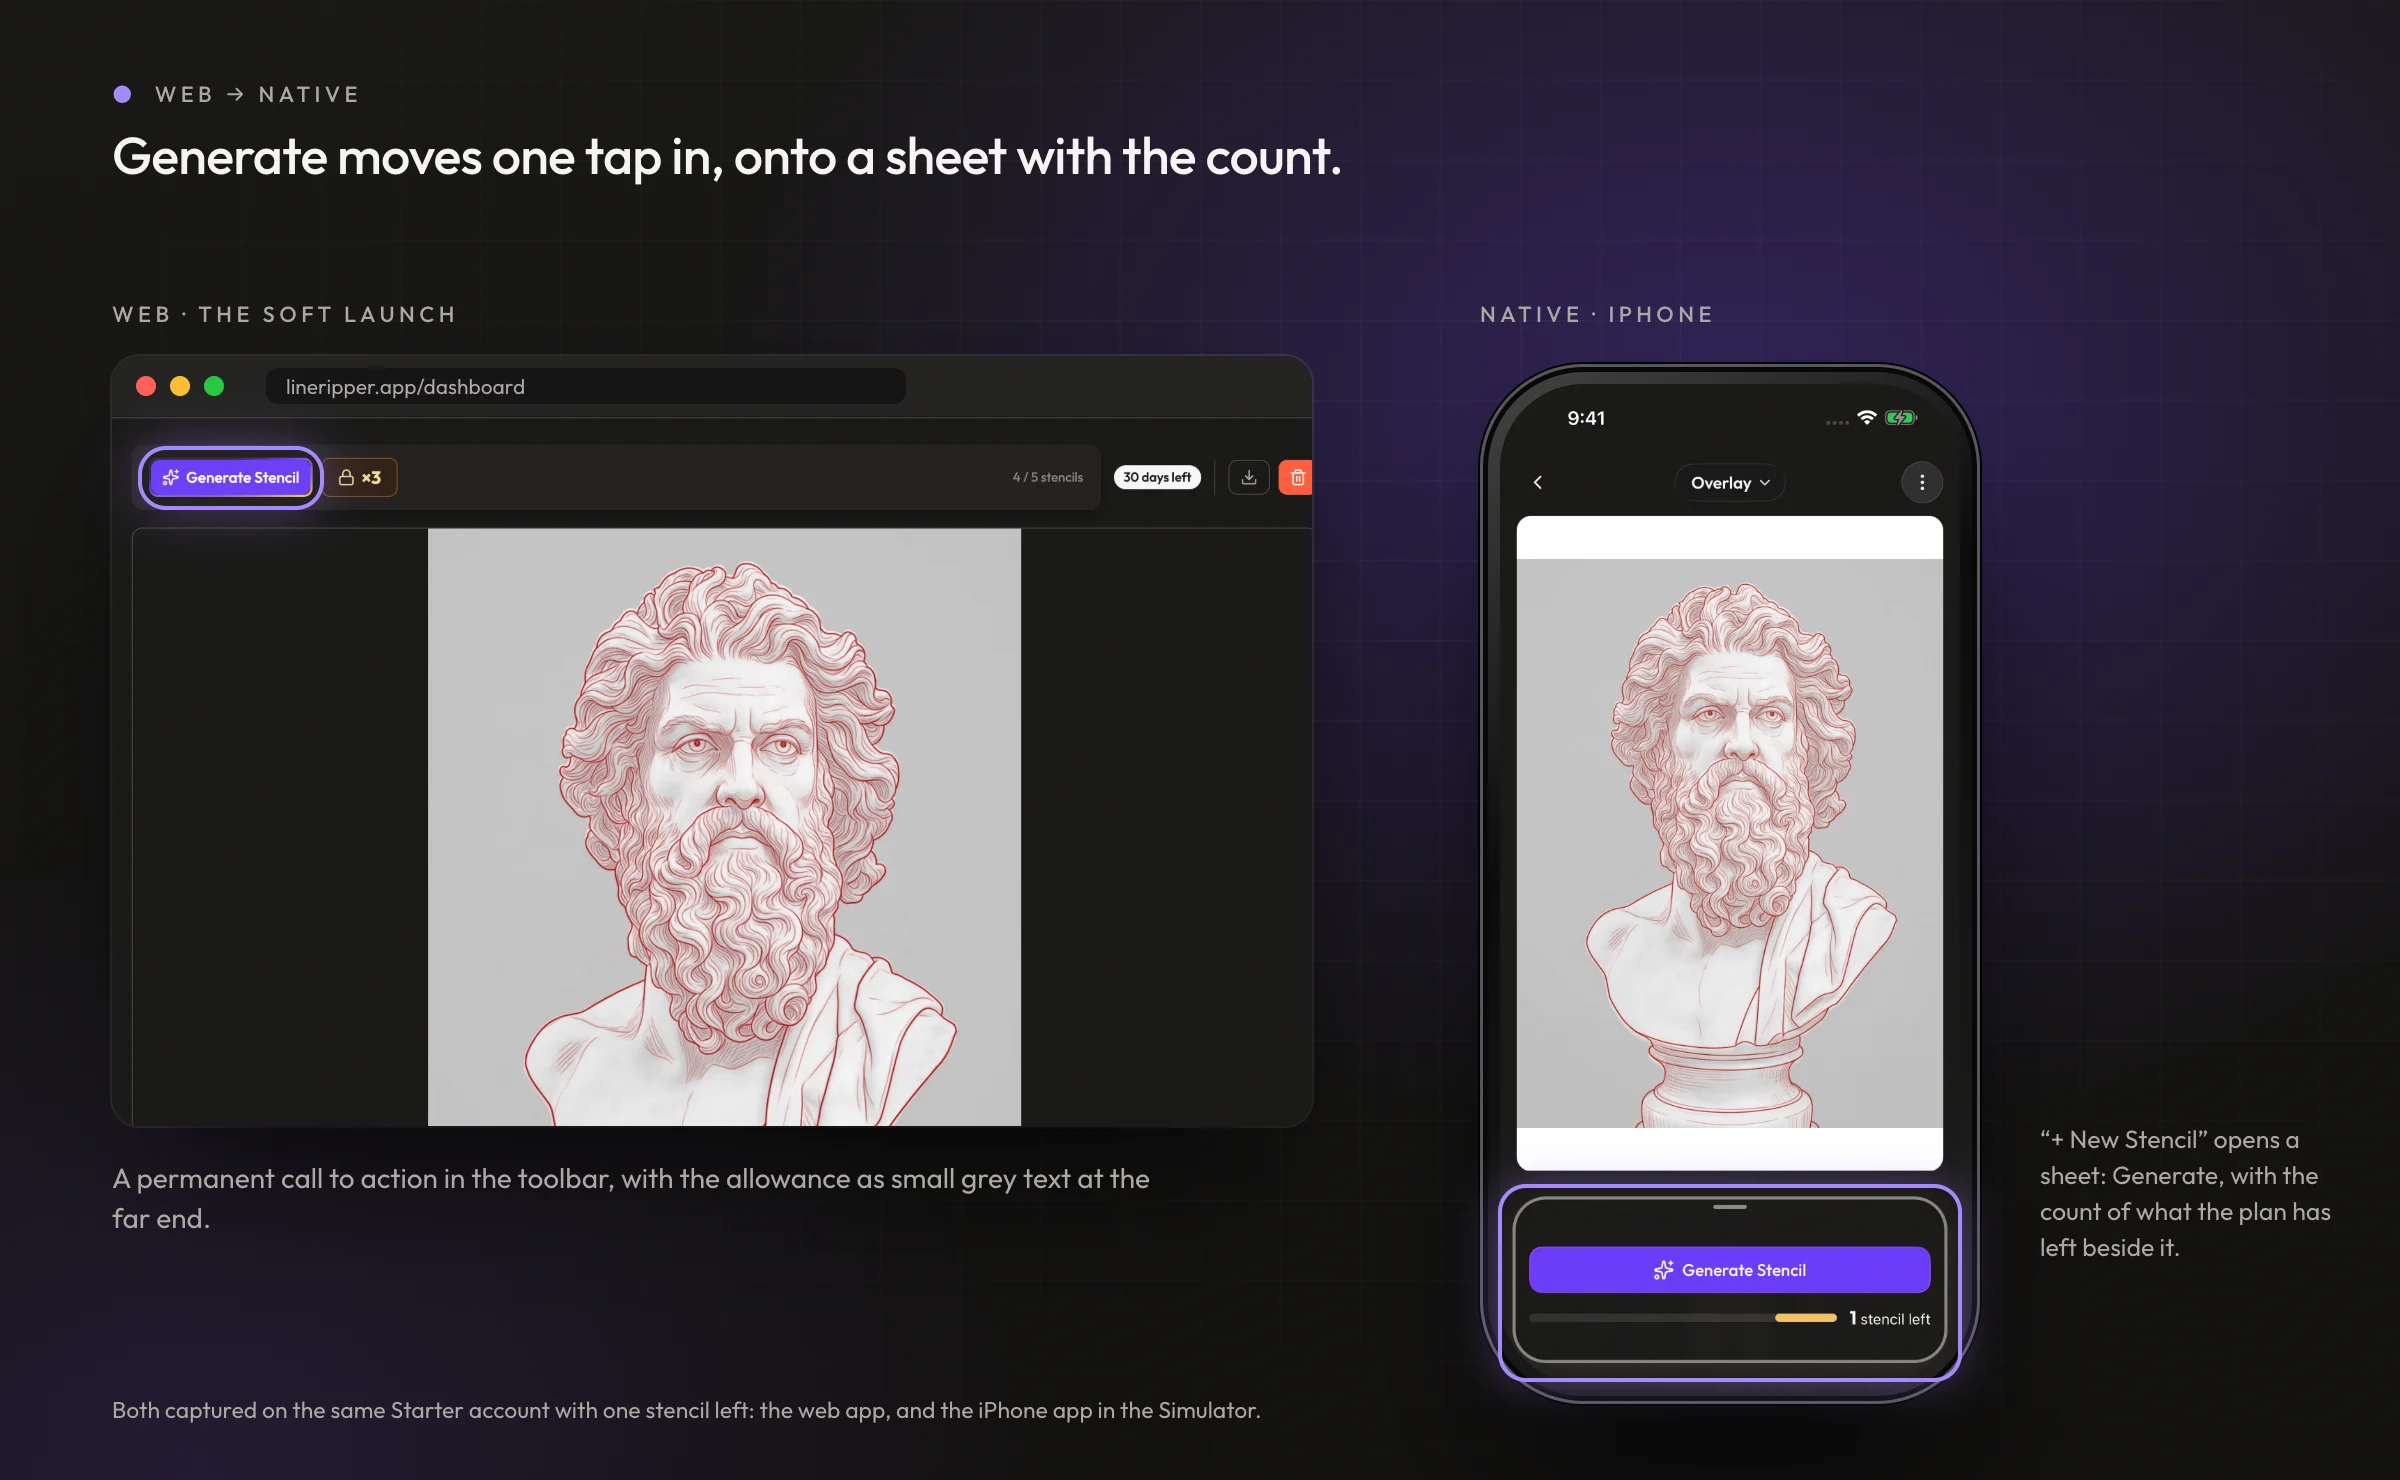
On the web, Generate is always one click away. In the app it sits one tap in, behind “+ New Stencil”, on a sheet that also carries the count of what the plan has left. On the iPad there is room, so the same pairing stays on screen in the side panel.
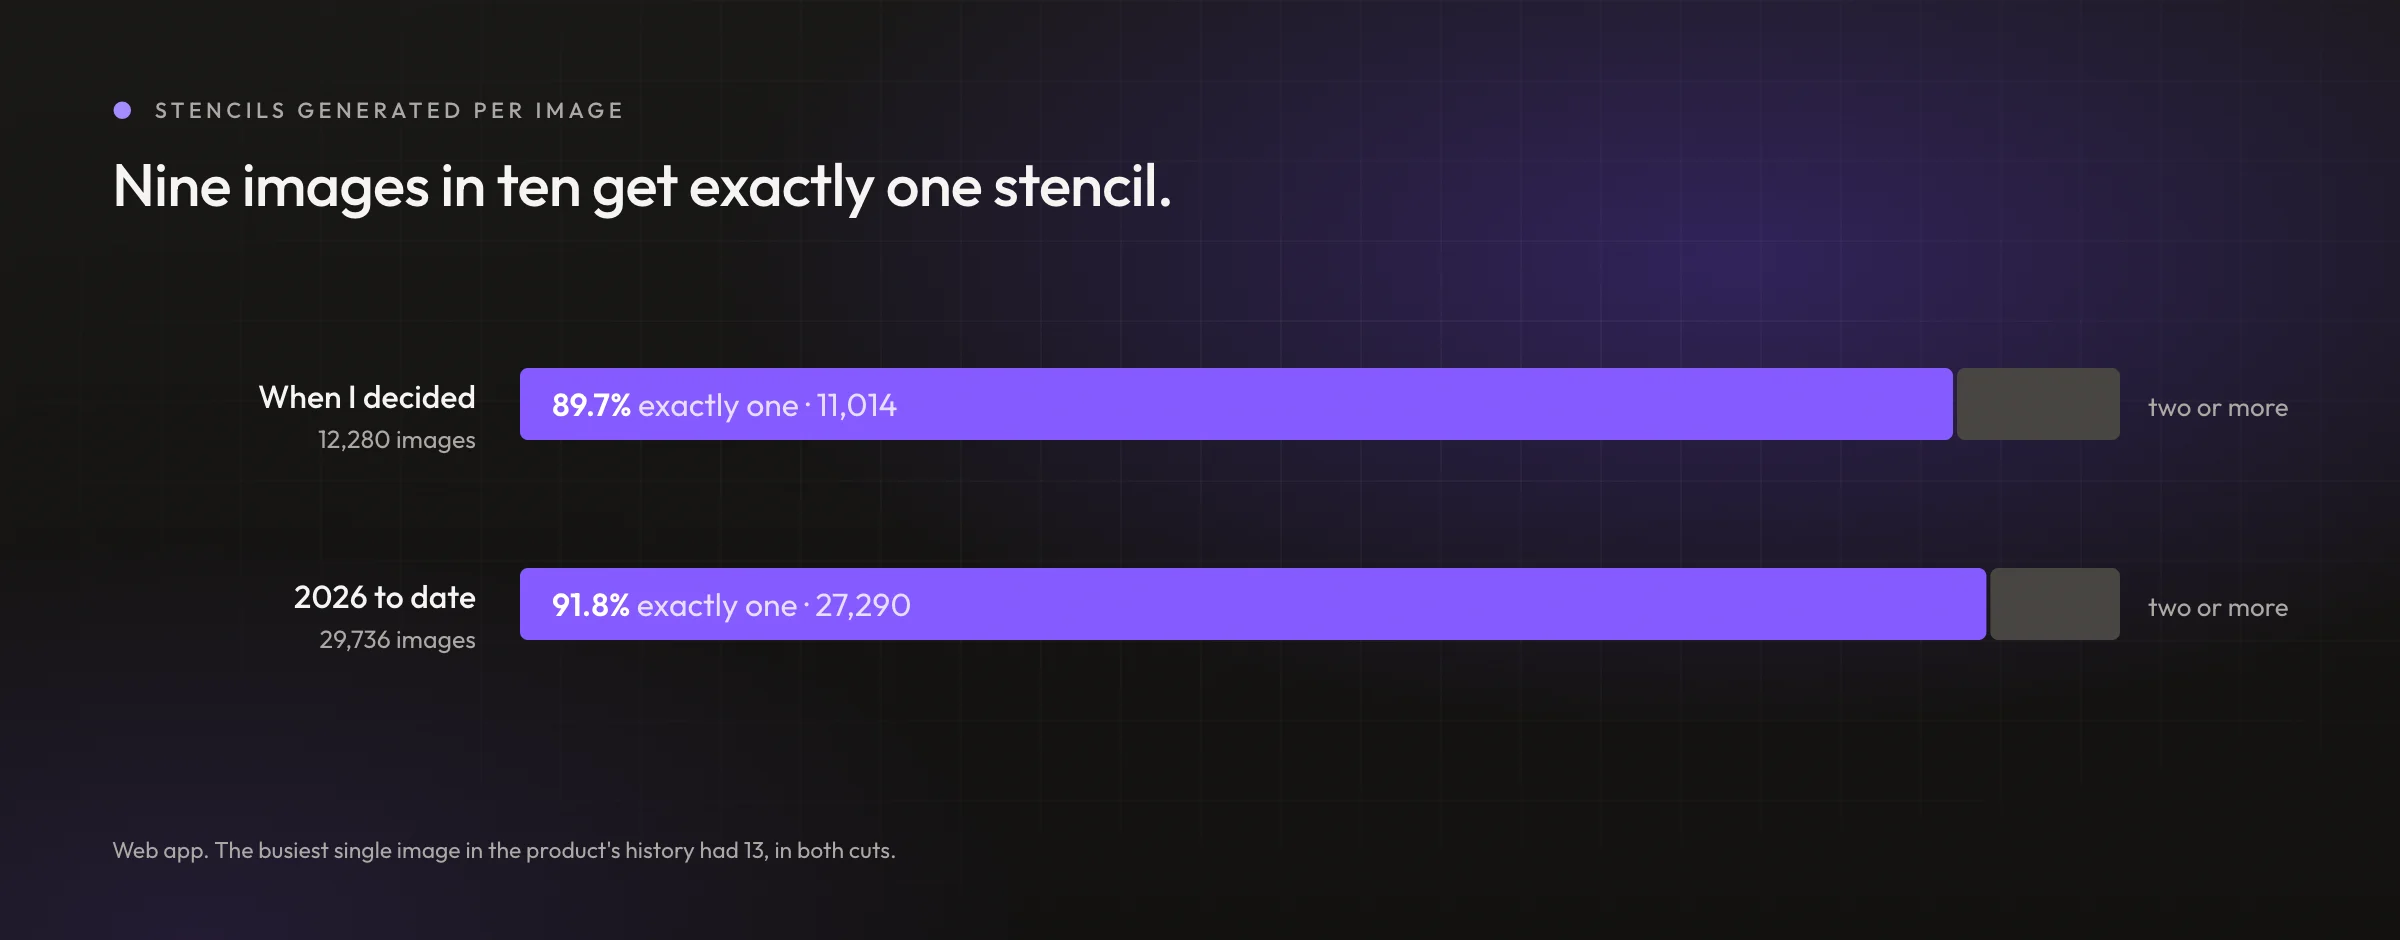
The premise held. When I made the call, 11,014 of 12,280 images had exactly one stencil generated against them. Re-run across 2026 to date it is 27,290 of 29,736, just under 92%, on well over twice the volume. In both cuts the busiest single image in the product's history had 13. The full reasoning is in the decision log for 16 June.
The full reasoning
- The fork. Generate Stencil sits permanently in the Studio bar as the main call to action, or it sits one deliberate tap in.
- What I didn't take. The permanent button, which is the reflex. The app exists to generate stencils.
- What I chose. One step in, behind "+ New Stencil", on a sheet that also carries the count of what the plan has left.
- Why. Prominence should track how often something is used rather than how important it sounds, and the usage data said generating is a once-per-image job. It also stops a metered action being a hair trigger, which matters most for the free customer who has five. And giving the action a surface of its own made room for the remaining count, which informs the decision in the moment and is the honest place for an upgrade to sit.
- What I gave up. The most obvious conversion surface in the app, and one tap on every repeat generation.
- Then. Six days later I narrowed when that sheet opens by itself, so the first generation costs no extra tap at all. It opens right after you pick or upload an image, and when you open a Gallery image that has no stencils yet. An image that already has stencils is one you came back to look at, so opening the sheet there would cover the canvas in the exact moment you opened it to view.
The meter warns before the wall does.
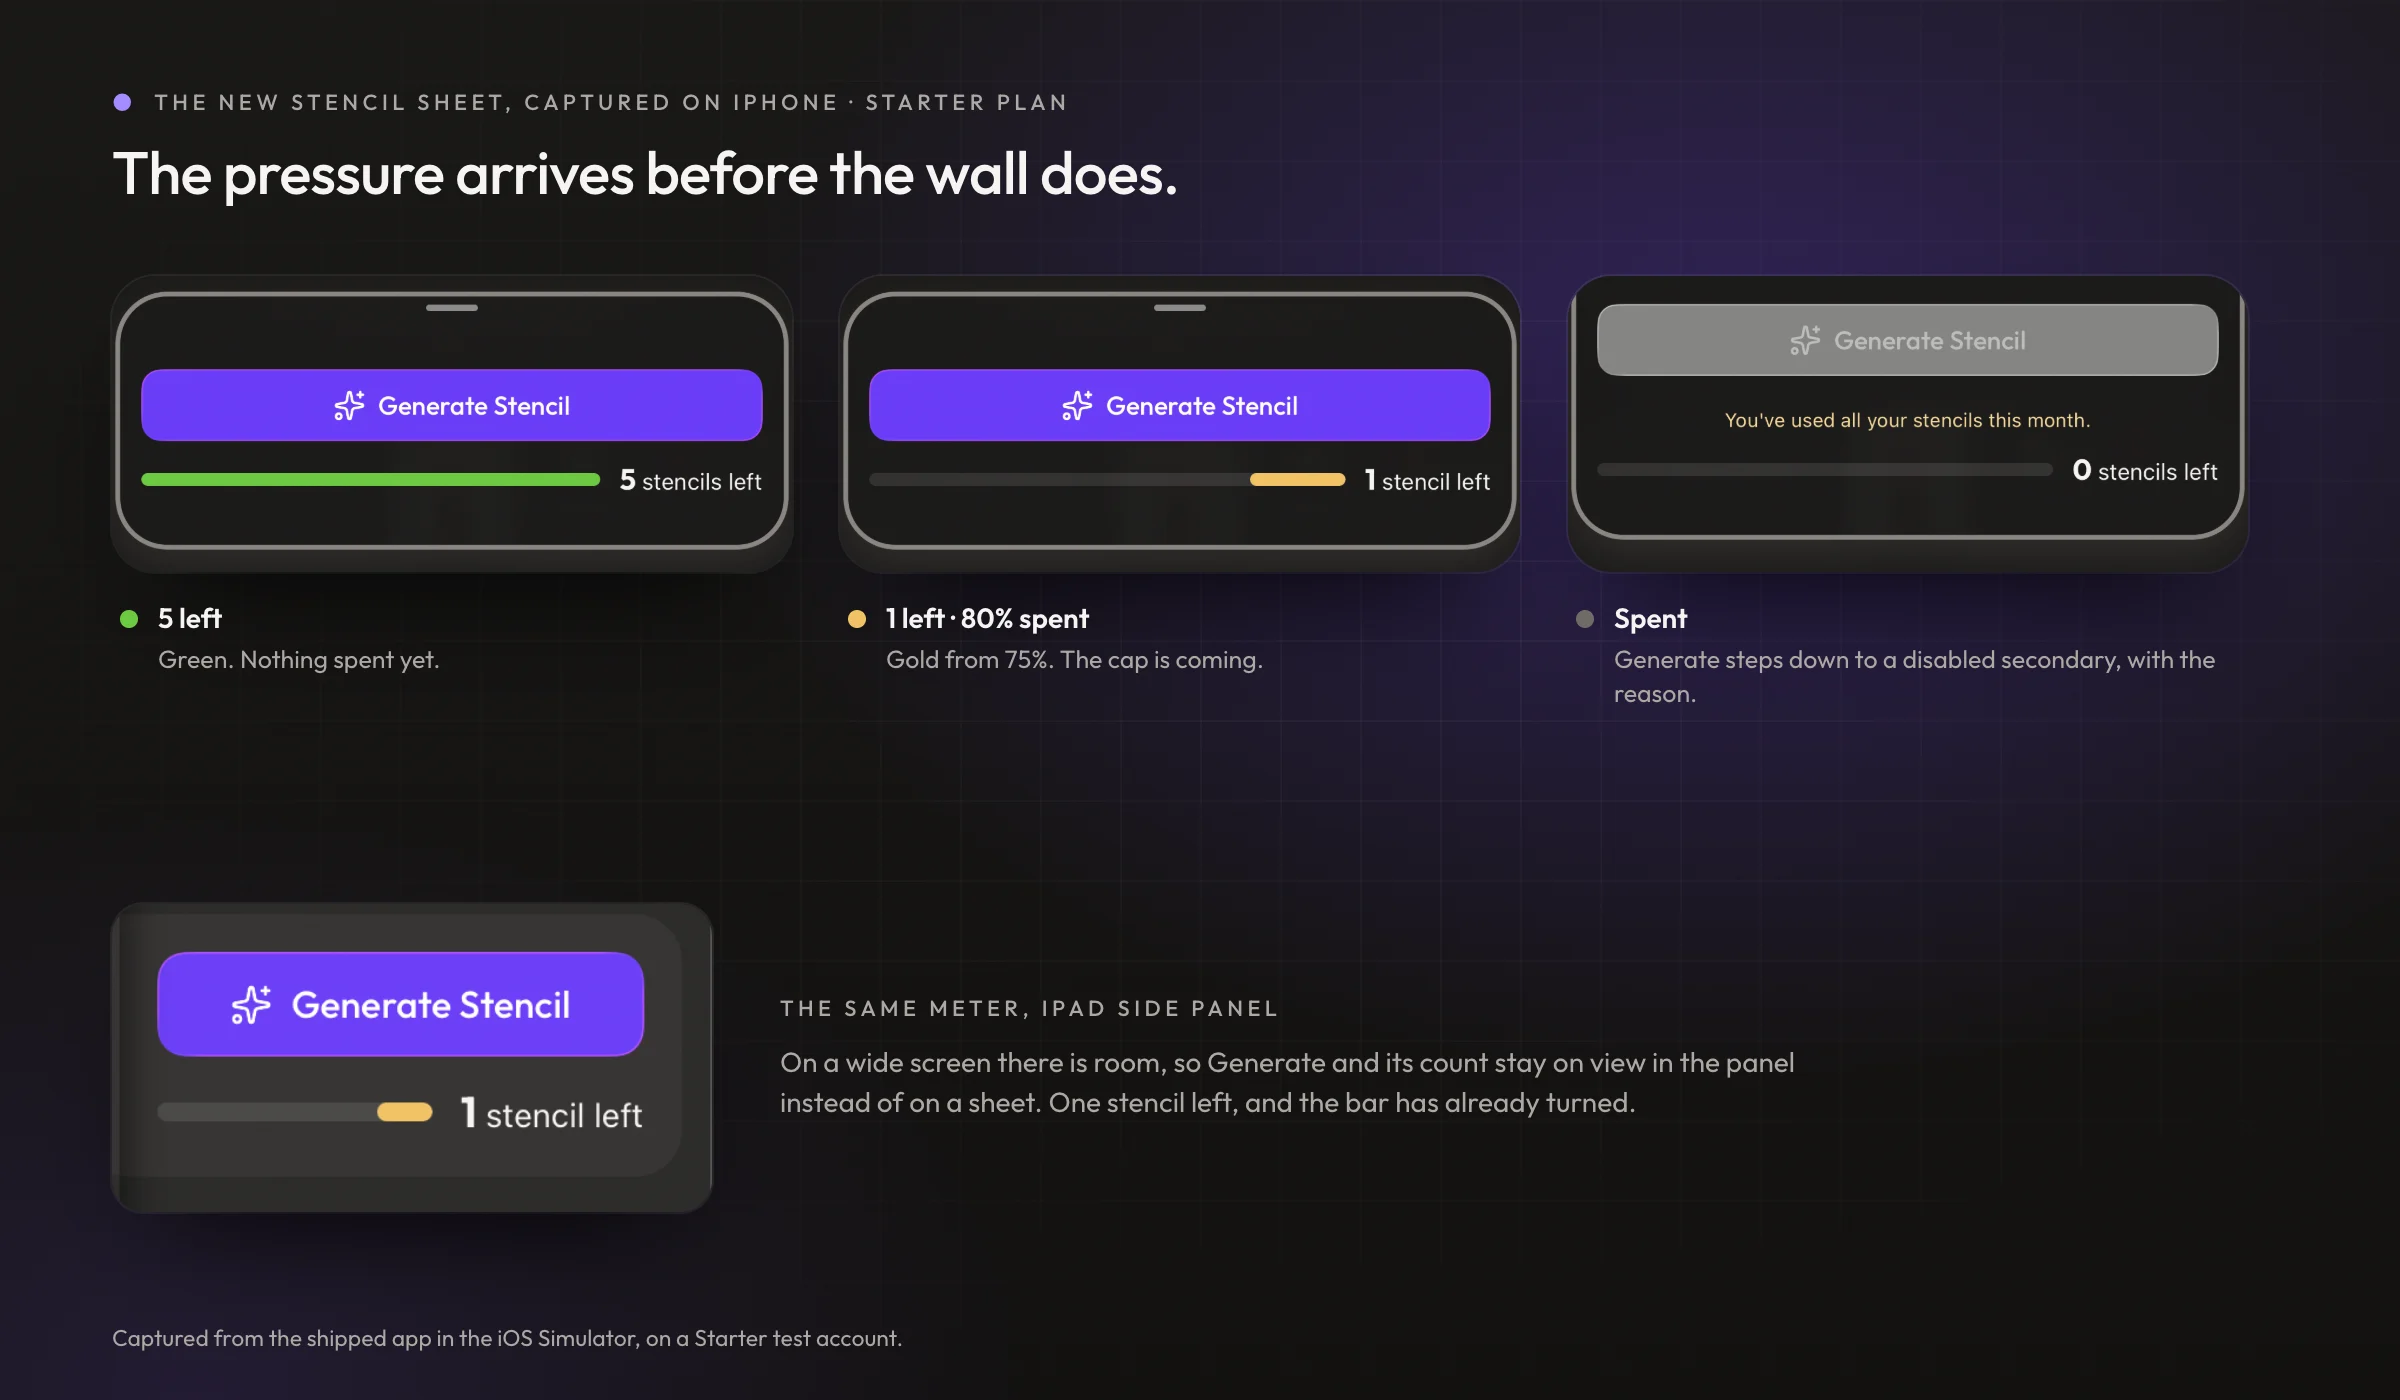
On the web, the allowance is grey text until it runs out, and the first strong signal is the wall itself. In the app it is a bar that turns honey at 75% spent and coral at 90%, and at zero the Generate button steps down to a disabled secondary and says why.
The full reasoning
- The fork. The remaining-stencils meter stays one flat green bar until it empties, or it escalates as the allowance is spent.
- What I didn't take. The flat bar. It reads "fine" right up until it reads "zero", which wastes the only moment that matters.
- What I chose. The fill stays green until 75% is spent, turns a caution gold past 75%, and goes red past 90%. The thresholds key off the share consumed rather than the count remaining. Separately, once the allowance is gone the Generate button drops from a disabled primary to a disabled secondary, so it stops competing with the upgrade call to action sitting next to it.
- Why. A limit is felt as a proportion, so the bands are phrased the way a customer would phrase it, which is that you have used 90%. And a control you cannot use should not hold the loudest styling on the screen in the exact moment that upgrading is the point. It stays visible rather than hidden, because the disabled button and the zero beside it are together what explain why generation stopped.
- What I gave up. A calm interface. This deliberately makes the app more insistent as a customer approaches their cap.
- Then. Building it surfaced that the palette had no colour that means caution. The band first borrowed the brand accent, which looks right and means the wrong thing, so I promoted a proper warning semantic rather than overloading the accent permanently.
A footnote worth keeping, because it cuts both ways. I pulled the cap numbers two months after making these decisions, and the analysis came back recommending a targeted upgrade prompt at the moment someone hits their fifth generation. It had no knowledge of the mobile app. That is close to what I built, and it is not the same. Prompting at the fifth generation is prompting at the wall. The reason the meter escalates at 75% and again at 90% is that the wall is the moment a customer has already been stopped, and the decision to upgrade is better made while they can still see it coming.
Deleting gives nothing back, and the dialog says so.
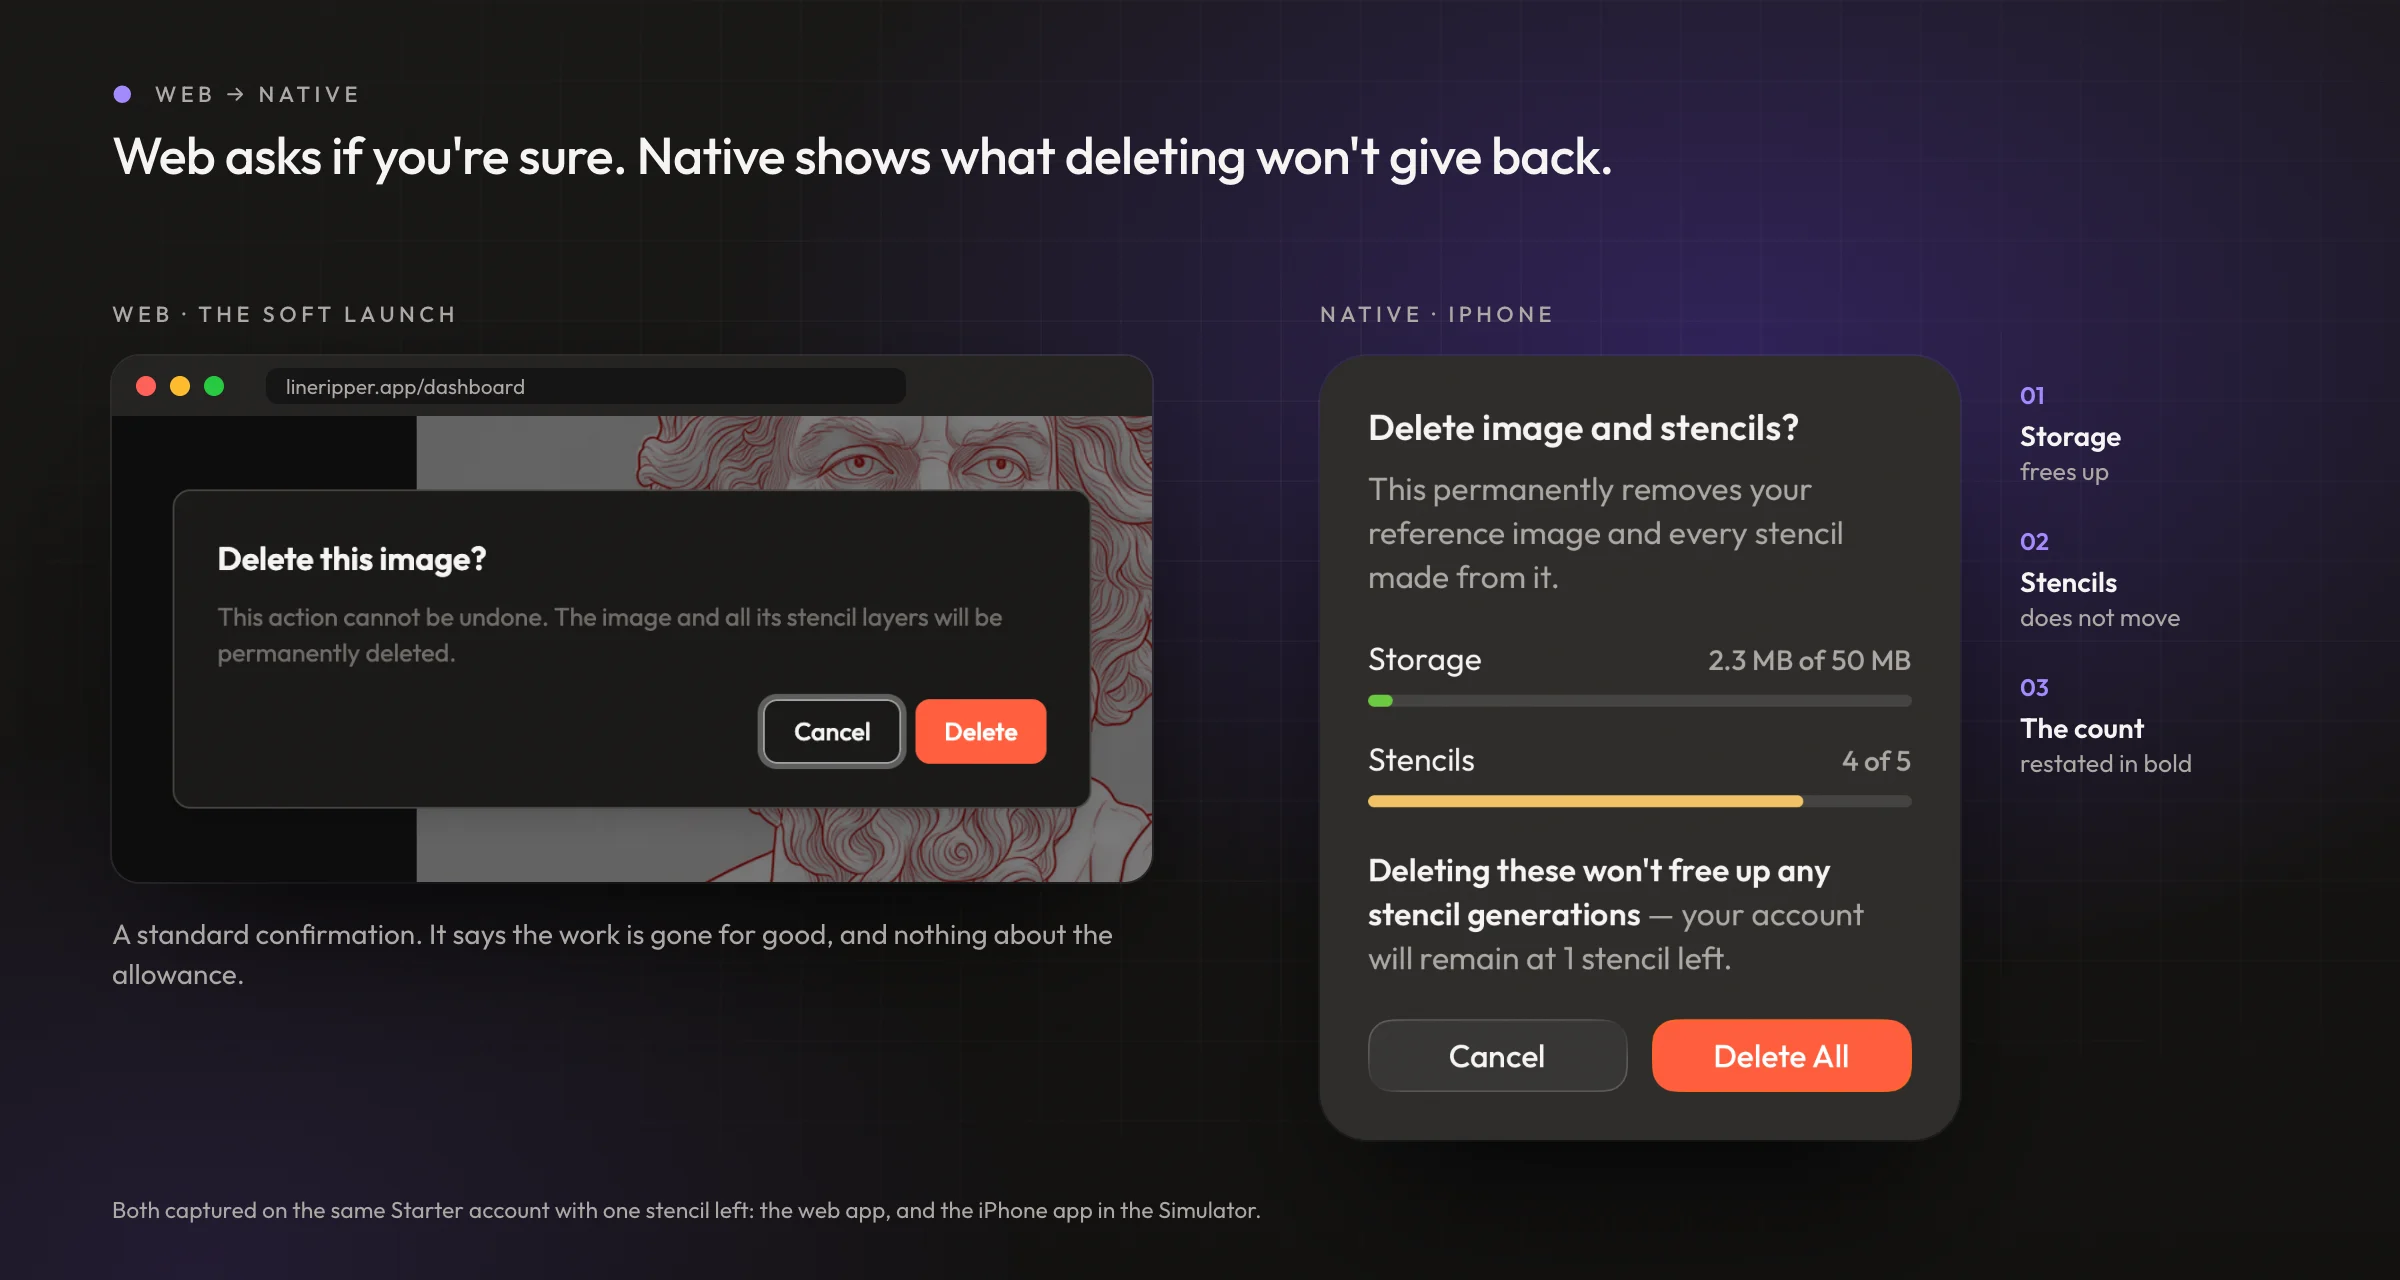
The tempting read is that deleting an image gives its generations back. The web dialog doesn't mention the allowance at all. The native one leads with the customer's live meters and then says, in bold, that deleting frees storage and nothing else.
The full reasoning
- The fork. Deleting an image and its stencils uses the phone's built-in confirmation, or a surface of its own.
- What I didn't take. The native alert. It can hold a title and a sentence, and nothing else.
- What I chose. A card that leads with the customer's live numbers, their storage against their allowance and the same stencil meter they see when generating, then states in bold that deleting will not free up any generations, then restates how many they will still have.
- Why. The tempting read is that deleting claws credits back, so you could delete a few and make a few more. It does not work that way, and a customer who believes it will delete their work to find out. Putting the live meter directly above the warning makes the warning land against a real number instead of an abstract claim.
- What I gave up. A heavier surface for a routine action, and a component to maintain where the platform offered one free.
What this doesn't solve.
The same analysis that confirmed the cap is felt also says the cap is not where the business loses people. Of 1,755 active free customers in their first billing cycle, 336 were still active in their second. That is a drop of 81%, and it is larger than anything else on this page.
It does not undo the work, and the reason is the timing. The median customer who upgrades does it inside that first cycle, before the cliff and before their allowance resets. So the upgrade ladder is working in the window where the customers still are. But the mean time to convert is nearly twice the median, at just over 24 days, which says a real group upgrades in or after a second cycle. Those are the customers who waited for the reset, spent five again, and only then paid.
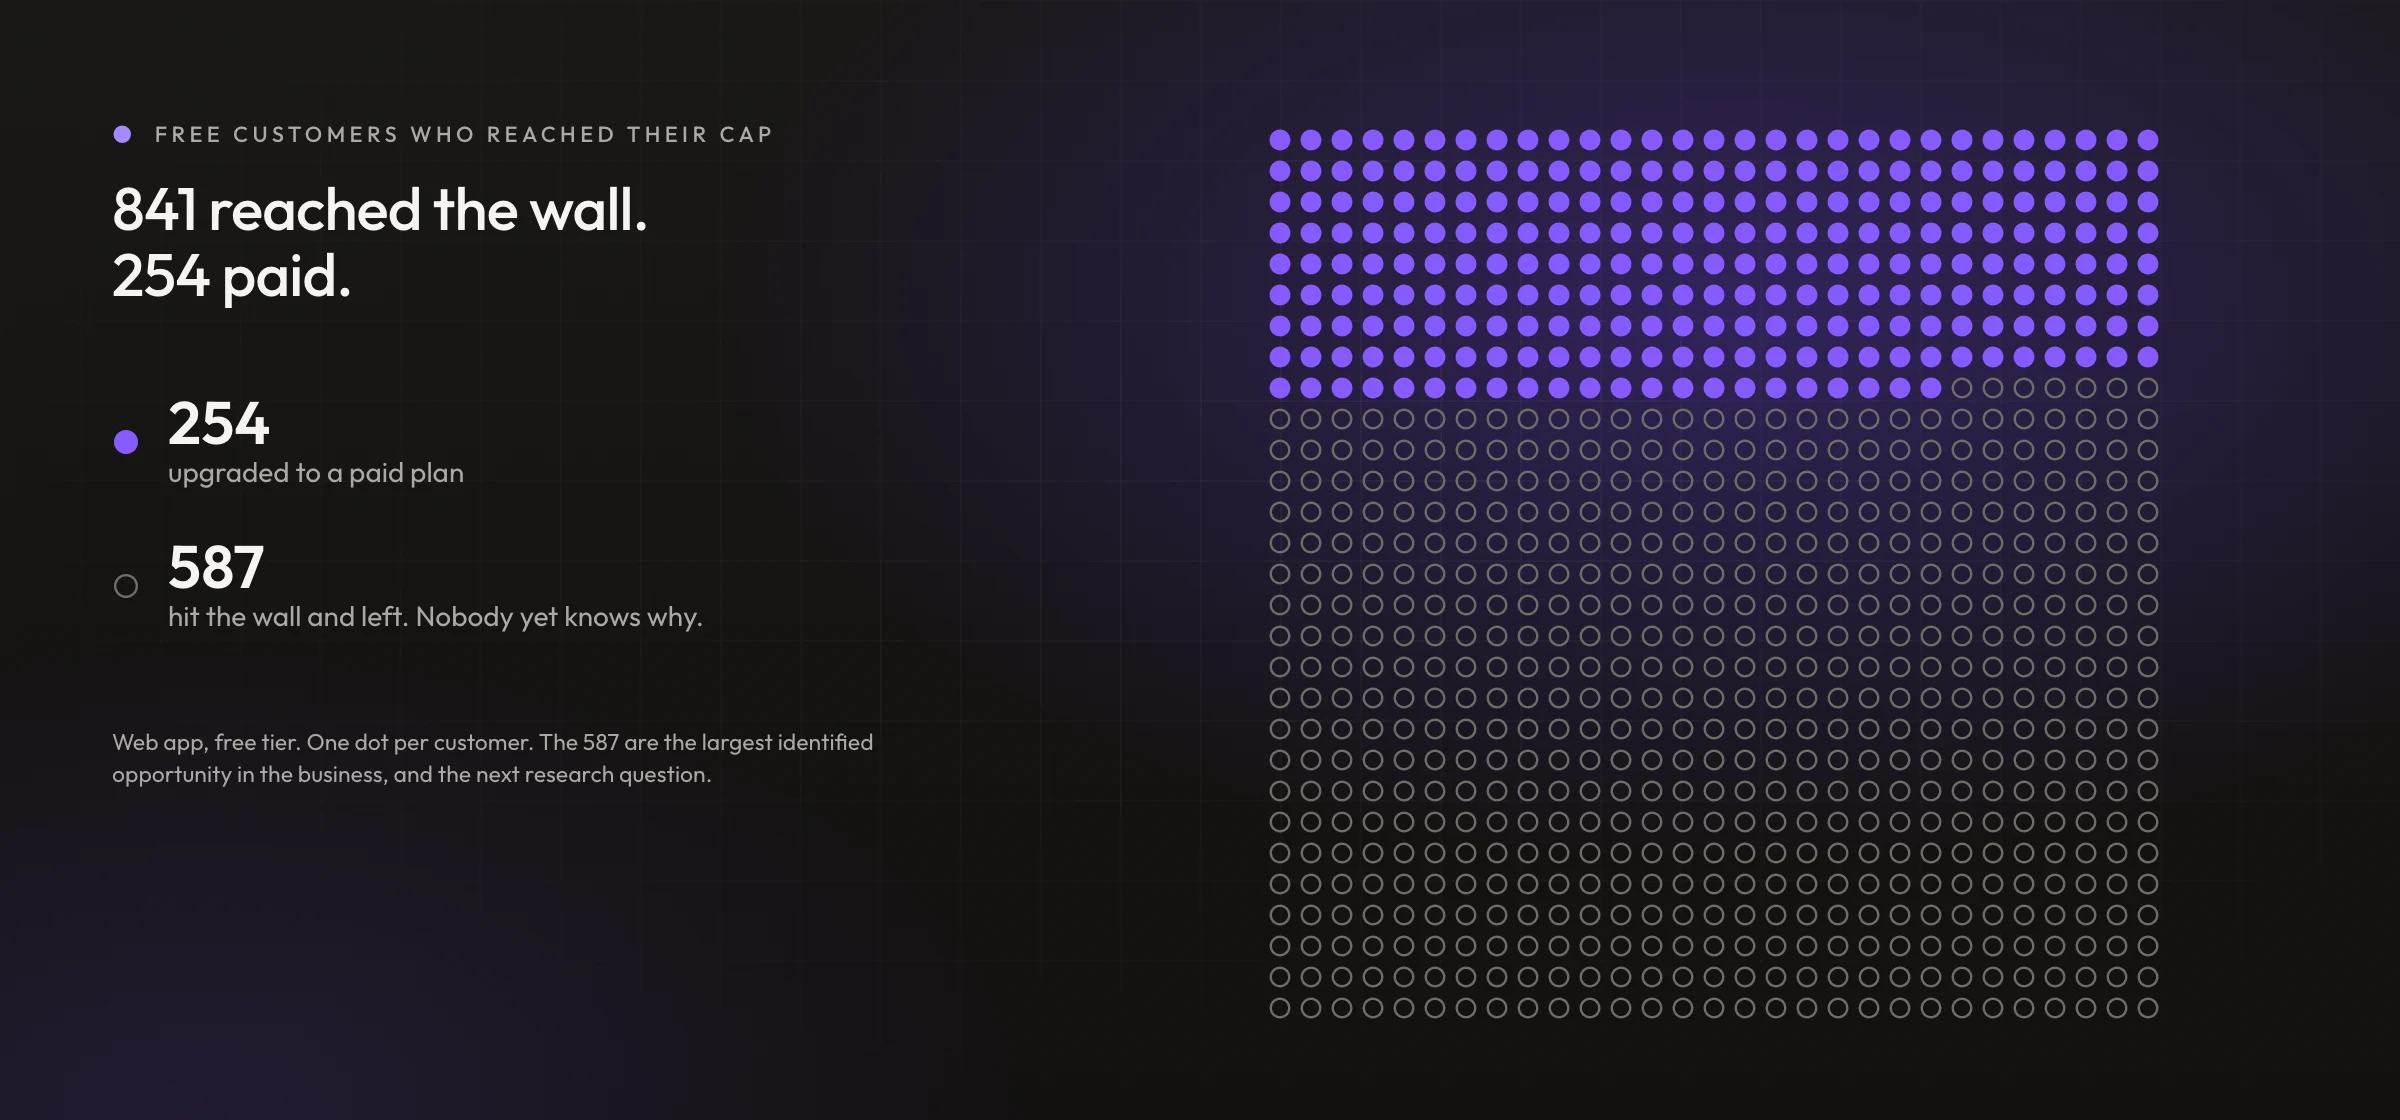
The sharper gap is inside the group I did design for. 841 customers reached the wall. 254 paid. The other 587 hit it and walked away, and I do not know why. That is the single largest identified opportunity in the business, and none of these decisions can tell me whether those customers left because the price was wrong, the moment was wrong, or the product had already given them what they came for.
It is also the honest test of everything above. The mobile app makes the approach to that wall legible and hands the upgrade priority when it arrives. If those 587 are leaving because the wall arrived without warning, this work should move them. If they are leaving because $19 a month is more than a stencil is worth to them, it will not, and no amount of interface will fix it. I do not yet know which, and the research to find out is the next thing worth doing.
What I'd undo.
The app has been in customers' hands since 15 September, which is too soon for a regret with evidence behind it, and I would rather say that than invent one.
What I do have is a decision I already reversed, and it was mine. I asked for the reference card to shrink when the side panel collapses, to reclaim the empty space under its thumbnail. Two turns later I reversed it. Shrinking that one card pulled every card below it up the rail, which sent the Generate card on a jump of about a hundred points when the panel reopened. The tile you tap to open the panel is the thing that becomes the Generate card, so a long jump reads as two unrelated things rather than one becoming the other. I took the empty space back and accepted the dead area I had asked to remove.
The larger one is scope. Landscape iPad is the layout our customers will actually hold, and it is the part I had least time for. What shipped is an MVP against what I had in mind.
Every decision behind the app was written down as it was made, with the reasoning at the time and the option that lost. The full decision log is published as it was written.